Top Rankings
Steelton-Highspire School District ranks among the top 20% of public school district in Pennsylvania for:
Category
Attribute
Diversity
Most diverse schools (Top 1%)
For the 2025 school year, there are 2 public schools serving 1,374 students in Steelton-Highspire School District. This district's average testing ranking is 1/10, which is in the bottom 50% of public schools in Pennsylvania.
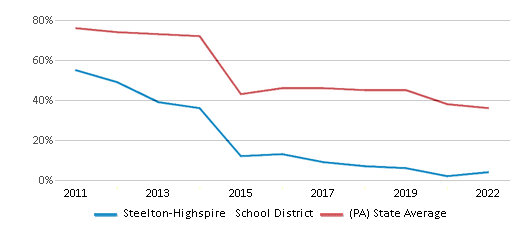
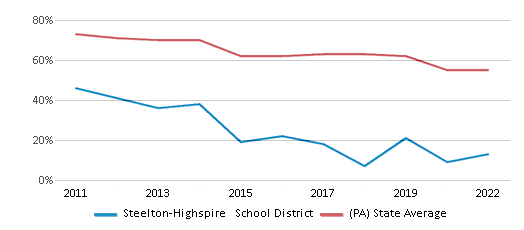
Public Schools in Steelton-Highspire School District have an average math proficiency score of 4% (versus the Pennsylvania public school average of 36%), and reading proficiency score of 13% (versus the 55% statewide average).
Minority enrollment is 90% of the student body (majority Black), which is more than the Pennsylvania public school average of 39% (majority Hispanic and Black).
Overview
This School District
This State (PA)
# Schools
2 Schools
2,928 Schools
# Students
1,374 Students
1,668,648 Students
# Teachers
105 Teachers
124,158 Teachers
Student : Teacher Ratio
13:1
13:1
District Rank
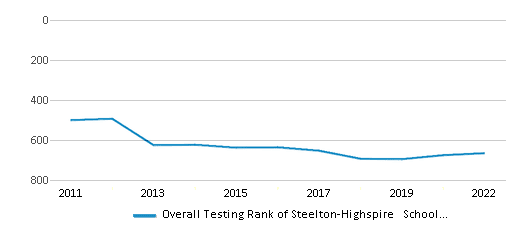
Steelton-Highspire School District, which is ranked within the bottom 50% of all 675 school districts in Pennsylvania (based off of combined math and reading proficiency testing data) for the 2021-2022 school year.
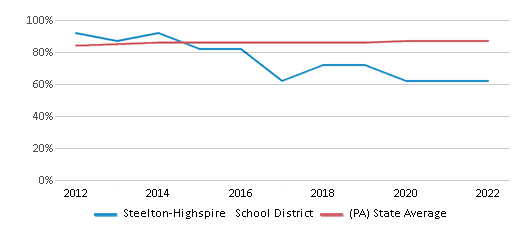
The school district's graduation rate of 60-64% has stayed relatively flat over five school years.
Overall District Rank
#665 out of 684 school districts
(Bottom 50%)
(Bottom 50%)
Math Test Scores (% Proficient)
4%
36%
Reading/Language Arts Test Scores (% Proficient)
13%
55%
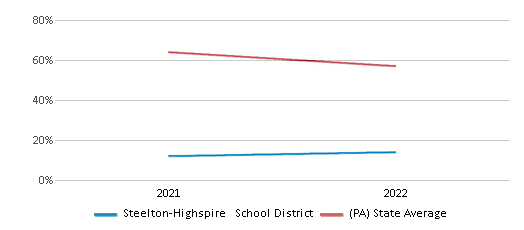
Science Test Scores (% Proficient)
14%
57%
Graduation Rate
60-64%
87%
Students by Ethnicity:
Diversity Score
0.65
0.59
# American Indian Students
3 Students
3,204 Students
% American Indian Students
n/a
n/a
# Asian Students
4 Students
78,034 Students
% Asian Students
n/a
5%
# Hispanic Students
378 Students
249,018 Students
% Hispanic Students
28%
15%
# Black Students
701 Students
237,342 Students
% Black Students
51%
14%
# White Students
140 Students
1,011,502 Students
% White Students
10%
61%
# Hawaiian Students
n/a
1,518 Students
% Hawaiian Students
n/a
n/a
# Two or more races Students
148 Students
88,750 Students
% of Two or more races Students
11%
5%
Students by Grade:
# Students in PK Grade:
-
8,485
# Students in K Grade:
107
114,122
# Students in 1st Grade:
107
120,768
# Students in 2nd Grade:
115
126,133
# Students in 3rd Grade:
108
120,907
# Students in 4th Grade:
112
125,578
# Students in 5th Grade:
110
126,001
# Students in 6th Grade:
100
126,714
# Students in 7th Grade:
106
128,950
# Students in 8th Grade:
98
129,786
# Students in 9th Grade:
125
141,323
# Students in 10th Grade:
114
138,358
# Students in 11th Grade:
81
131,939
# Students in 12th Grade:
91
129,584
# Ungraded Students:
-
-
District Revenue and Spending
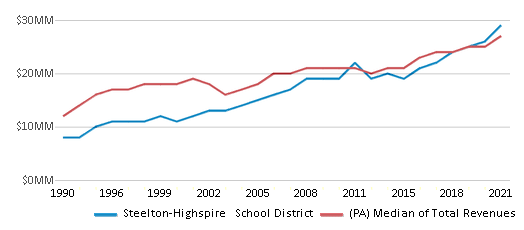
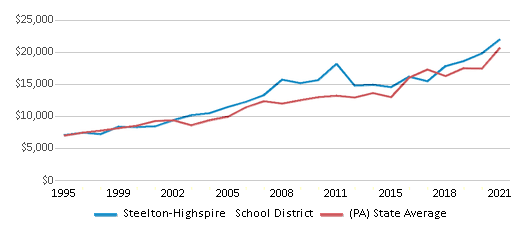
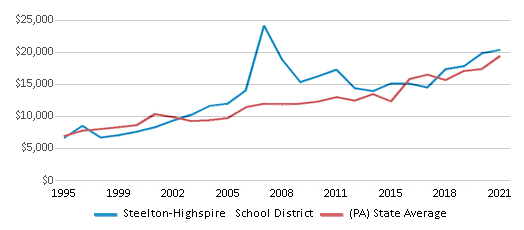
The revenue/student of $20,827 in this school district is less than the state median of $23,696. The school district revenue/student has declined by 5% over four school years.
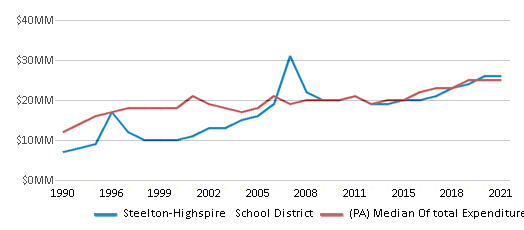
The school district's spending/student of $19,270 is less than the state median of $23,119. The school district spending/student has declined by 5% over four school years.
Total Revenue
$29 MM
$39,541 MM
Spending
$27 MM
$38,578 MM
Revenue / Student
$20,827
$23,696
Spending / Student
$19,270
$23,119
Best Steelton-Highspire School District Public Schools (2025)
School
(Math and Reading Proficiency)
(Math and Reading Proficiency)
Location
Grades
Students
Rank: #11.
Steelton-highspire Elementary School
(Math: 6% | Reading: 12%)
Rank:
Rank:
1/
Bottom 50%10
250 Reynders Avenue
Harrisburg, PA 17113
(717) 704-3826
Harrisburg, PA 17113
(717) 704-3826
Grades: K-6
| 759 students
Rank: #22.
Steelton-highspire High School
(Math: 2% | Reading: 14%)
Rank:
Rank:
1/
Bottom 50%10
250 Reynders Ave.
Harrisburg, PA 17113
(717) 704-3809
Harrisburg, PA 17113
(717) 704-3809
Grades: 7-12
| 615 students
Frequently Asked Questions
How many schools belong to Steelton-Highspire School District?
Steelton-Highspire School District manages 2 public schools serving 1,374 students.
What is the rank of Steelton-Highspire School District?
Steelton-Highspire School District is ranked #661 out of 675 school districts in Pennsylvania (bottom 50%) based off of combined math and reading proficiency testing data for the 2021-2022 school year. This district ranks in the top 20% of Pennsylvania school districts for: Most diverse schools (Top 1%)
What is the racial composition of students in Steelton-Highspire School District?
51% of Steelton-Highspire School District students are Black, 28% of students are Hispanic, 11% of students are Two or more races, and 10% of students are White.
What is the student/teacher ratio of Steelton-Highspire School District?
Steelton-Highspire School District has a student/teacher ratio of 13:1, which is lower than the Pennsylvania state average of 14:1.
What is Steelton-Highspire School District's spending/student ratio?
The school district's spending/student of $19,270 is less than the state median of $23,119. The school district spending/student has declined by 5% over four school years.
Recent Articles

What Is A Charter School?
Explore the world of charter schools in this comprehensive guide. Learn about their history, how they operate, and the pros and cons of this educational innovation. Discover key facts about charter schools, including admission policies, demographics, and funding, as well as what to look for when considering a charter school for your child.

10 Reasons Why High School Sports Benefit Students
Discover the 10 compelling reasons why high school sports are beneficial for students. This comprehensive article explores how athletics enhance academic performance, foster personal growth, and develop crucial life skills. From improved fitness and time management to leadership development and community representation, learn why participating in high school sports can be a game-changer for students' overall success and well-being.

February 05, 2025
Understanding the U.S. Department of Education: Structure, Impact, and EvolutionWe explore how the Department of Education shapes American education, from its cabinet-level leadership to its impact on millions of students, written for general audiences seeking clarity on this vital institution.


