Top Rankings
Aiken 01 School District ranks among the top 20% of public school district in South Carolina for:
Category
Attribute
Graduation Rate
Highest graduation rate (Top 20%)
Diversity
Most diverse schools (Top 1%)
Community Size
Largest student body (number of students) (Top 1%)
For the 2025 school year, there are 21 public preschools serving 10,800 students in Aiken 01 School District. This district's average pre testing ranking is 6/10, which is in the top 50% of public pre schools in South Carolina.
Public Preschools in Aiken 01 School District have an average math proficiency score of 39% (versus the South Carolina public pre school average of 45%), and reading proficiency score of 44% (versus the 48% statewide average).
Minority enrollment is 57% of the student body (majority Black), which is more than the South Carolina public preschool average of 54% (majority Black).
Overview
This School District
This State (SC)
# Schools
42 Schools
578 Schools
# Students
23,297 Students
307,049 Students
# Teachers
1,553 Teachers
22,837 Teachers
Student : Teacher Ratio
15:1
15:1
District Rank
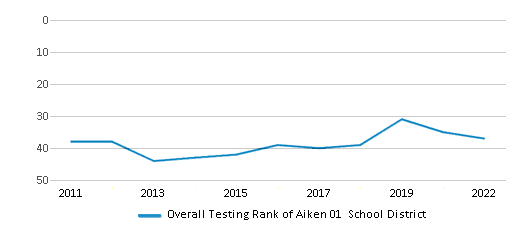
Aiken 01 School District, which is ranked within the top 50% of all 76 school districts in South Carolina (based off of combined math and reading proficiency testing data) for the 2021-2022 school year.
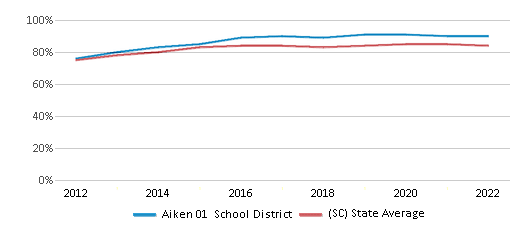
The school district's graduation rate of 90% has stayed relatively flat over five school years.
Overall District Rank
#37 out of 81 school districts
(Top 50%)
(Top 50%)
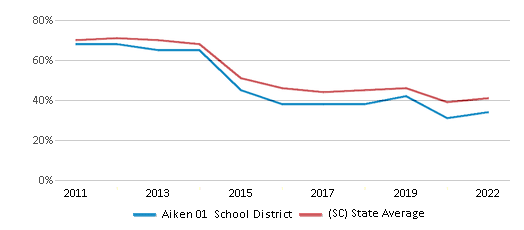
Math Test Scores (% Proficient)
34%
41%
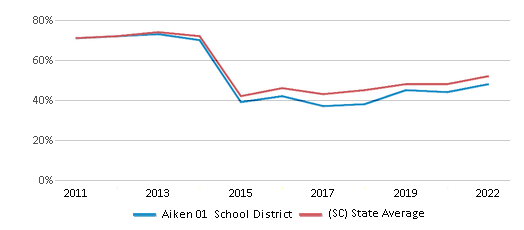
Reading/Language Arts Test Scores (% Proficient)
48%
52%
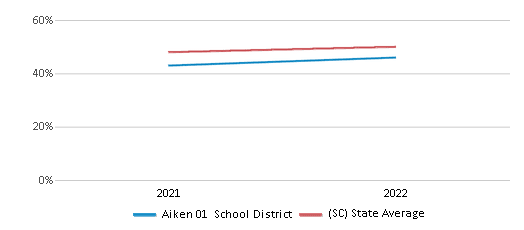
Science Test Scores (% Proficient)
46%
50%
Graduation Rate
90%
84%
Students by Ethnicity:
Diversity Score
0.68
0.67
# American Indian Students
39 Students
905 Students
% American Indian Students
n/a
n/a
# Asian Students
180 Students
4,942 Students
% Asian Students
1%
1%
# Hispanic Students
3,431 Students
41,883 Students
% Hispanic Students
15%
14%
# Black Students
7,699 Students
97,124 Students
% Black Students
33%
32%
# White Students
10,285 Students
140,483 Students
% White Students
44%
46%
# Hawaiian Students
19 Students
402 Students
% Hawaiian Students
n/a
n/a
# Two or more races Students
1,644 Students
21,254 Students
% of Two or more races Students
7%
7%
Students by Grade:
# Students in PK Grade:
697
27,258
# Students in K Grade:
1,567
46,285
# Students in 1st Grade:
1,759
47,365
# Students in 2nd Grade:
1,712
48,243
# Students in 3rd Grade:
1,744
43,895
# Students in 4th Grade:
1,789
43,663
# Students in 5th Grade:
1,532
40,854
# Students in 6th Grade:
1,733
3,355
# Students in 7th Grade:
1,735
2,477
# Students in 8th Grade:
1,805
2,190
# Students in 9th Grade:
2,160
439
# Students in 10th Grade:
1,905
373
# Students in 11th Grade:
1,625
325
# Students in 12th Grade:
1,534
327
# Ungraded Students:
-
-
District Revenue and Spending
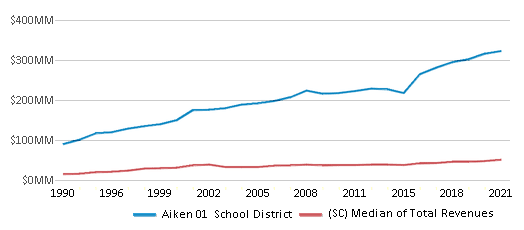
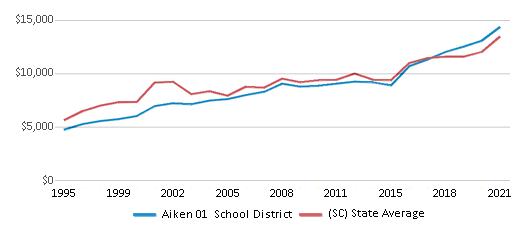
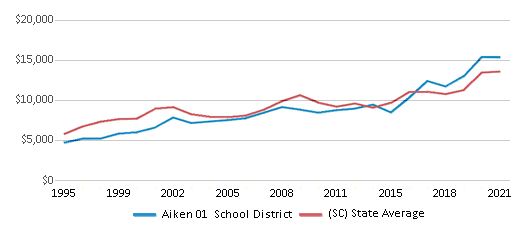
The revenue/student of $13,878 in this school district is less than the state median of $15,220. The school district revenue/student has stayed relatively flat over four school years.
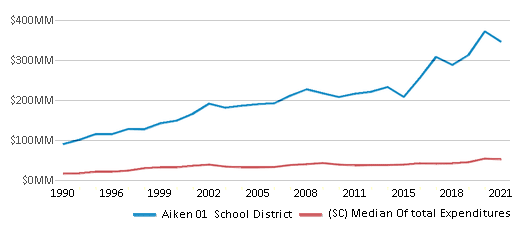
The school district's spending/student of $14,850 is higher than the state median of $14,817. The school district spending/student has stayed relatively flat over four school years.
Total Revenue
$323 MM
$12,084 MM
Spending
$346 MM
$11,764 MM
Revenue / Student
$13,878
$15,220
Spending / Student
$14,850
$14,817
Best Aiken 01 School District Public Preschools (2025)
School
(Math and Reading Proficiency)
(Math and Reading Proficiency)
Location
Grades
Students
Rank: #11.
Hammond Hill Elementary School
(Math: 59% | Reading: 53%)
Rank:
Rank:
7/
Top 50%10
901 West Woodlawn Avenue
North Augusta, SC 29841
(803) 442-6170
North Augusta, SC 29841
(803) 442-6170
Grades: PK-5
| 663 students
Rank: #22.
Millbrook Elementary School
(Math: 53% | Reading: 55%)
Rank:
Rank:
7/
Top 50%10
255 East Pine Log Road
Aiken, SC 29803
(803) 641-2580
Aiken, SC 29803
(803) 641-2580
Grades: PK-5
| 684 students
Rank: #33.
Clearwater Elementary School
(Math: 50-54% | Reading: 50-54%)
Rank:
Rank:
7/
Top 50%10
4552 Augusta Road
Clearwater, SC 29822
(803) 593-7240
Clearwater, SC 29822
(803) 593-7240
Grades: PK-5
| 352 students
Rank: #44.
Mossy Creek Elementary School
(Math: 50% | Reading: 54%)
Rank:
Rank:
7/
Top 50%10
421 West Five Notch Road
North Augusta, SC 29841
(803) 442-6090
North Augusta, SC 29841
(803) 442-6090
Grades: PK-5
| 691 students
Rank: #55.
Chukker Creek Elementary School
(Math: 47% | Reading: 55%)
Rank:
Rank:
7/
Top 50%10
1830 Chukker Creek Road
Aiken, SC 29803
(803) 641-2474
Aiken, SC 29803
(803) 641-2474
Grades: PK-5
| 644 students
Rank: #66.
Gloverville Elementary School
(Math: 45-49% | Reading: 50-54%)
Rank:
Rank:
6/
Top 50%10
114 Gloria Rush Circle
Gloverville, SC 29828
(803) 593-7280
Gloverville, SC 29828
(803) 593-7280
Grades: PK-5
| 334 students
Rank: #77.
Aiken Elementary School
(Math: 46% | Reading: 53%)
Rank:
Rank:
6/
Top 50%10
2050 Pine Log Road
Aiken, SC 29803
(803) 641-2740
Aiken, SC 29803
(803) 641-2740
Grades: PK-5
| 525 students
Rank: #88.
East Aiken School Of The Arts
(Math: 45% | Reading: 51%)
Rank:
Rank:
6/
Top 50%10
223 Old Wagener Road
Aiken, SC 29801
(803) 641-2450
Aiken, SC 29801
(803) 641-2450
Grades: PK-5
| 542 students
Rank: #99.
North Augusta Elementary School
(Math: 44% | Reading: 50%)
Rank:
Rank:
6/
Top 50%10
400 East Spring Grove Avenue
North Augusta, SC 29841
(803) 442-6280
North Augusta, SC 29841
(803) 442-6280
Grades: PK-5
| 652 students
Rank: #1010.
Belvedere Elementary School
(Math: 37% | Reading: 47%)
Rank:
Rank:
5/
Bottom 50%10
201 Rhomboid Place
North Augusta, SC 29841
(803) 442-6330
North Augusta, SC 29841
(803) 442-6330
Grades: PK-5
| 621 students
Rank: #1111.
Redcliffe Elementary School
(Math: 38% | Reading: 42%)
Rank:
Rank:
5/
Bottom 50%10
22 Double Springs Road
Aiken, SC 29803
(803) 827-3350
Aiken, SC 29803
(803) 827-3350
Grades: PK-5
| 610 students
Rank: #12 - 1312. - 13.
Graniteville Elementary School
(Math: 35-39% | Reading: 40-44%)
Rank:
Rank:
4/
Bottom 50%10
1 Willis Circle
Graniteville, SC 29829
(803) 564-1058
Graniteville, SC 29829
(803) 564-1058
Grades: PK-5
| 381 students
Rank: #12 - 1312. - 13.
Oakwood-windsor Elementary School
(Math: 35-39% | Reading: 40-44%)
Rank:
Rank:
4/
Bottom 50%10
3773 Charleston Highway
Aiken, SC 29801
(803) 641-2560
Aiken, SC 29801
(803) 641-2560
Grades: PK-5
| 445 students
Rank: #1414.
Jefferson Elementary School
(Math: 35% | Reading: 40%)
Rank:
Rank:
4/
Bottom 50%10
170 Flint Drive
Warrenville, SC 29851
(803) 593-7180
Warrenville, SC 29851
(803) 593-7180
Grades: PK-5
| 552 students
Rank: #1515.
Warrenville Elementary School
(Math: 30-34% | Reading: 35-39%)
Rank:
Rank:
4/
Bottom 50%10
569 Howlandville Road
Warrenville, SC 29851
(803) 663-4270
Warrenville, SC 29851
(803) 663-4270
Grades: PK-5
| 395 students
Rank: #1616.
Byrd Elementary School
(Math: 26% | Reading: 38%)
Rank:
Rank:
3/
Bottom 50%10
1225 Weldon Way
Graniteville, SC 29829
(803) 663-4320
Graniteville, SC 29829
(803) 663-4320
Grades: PK-5
| 690 students
Rank: #1717.
J. D. Lever Elementary School
(Math: 30-34% | Reading: 25-29%)
Rank:
Rank:
3/
Bottom 50%10
2404 Columbia Highway
Aiken, SC 29801
(803) 641-2760
Aiken, SC 29801
(803) 641-2760
Grades: PK-5
| 463 students
Rank: #1818.
Greendale Elementary School
(Math: 25-29% | Reading: 30-34%)
Rank:
Rank:
3/
Bottom 50%10
505 South Boundary Avenue
New Ellenton, SC 29809
(803) 652-8170
New Ellenton, SC 29809
(803) 652-8170
Grades: PK-5
| 297 students
Rank: #1919.
Ridge Spring-monetta Elementary School
(Math: 20-24% | Reading: 30-34%)
Rank:
Rank:
2/
Bottom 50%10
422 Hazzard Circle
Ridge Spring, SC 29129
(803) 685-2000
Ridge Spring, SC 29129
(803) 685-2000
Grades: PK-5
| 374 students
Rank: #2020.
Cyril B. Busbee Elementary School
(Math: 19% | Reading: 27%)
Rank:
Rank:
2/
Bottom 50%10
20 A.l. Corbett Circle
Wagener, SC 29164
(803) 564-1000
Wagener, SC 29164
(803) 564-1000
Grades: PK-5
| 461 students
Rank: #2121.
North Aiken Elementary School
(Math: 18% | Reading: 19%)
Rank:
Rank:
1/
Bottom 50%10
100 Bears Rock Road
Aiken, SC 29801
(803) 641-2690
Aiken, SC 29801
(803) 641-2690
Grades: PK-5
| 424 students
Recent Articles

What Is A Charter School?
Explore the world of charter schools in this comprehensive guide. Learn about their history, how they operate, and the pros and cons of this educational innovation. Discover key facts about charter schools, including admission policies, demographics, and funding, as well as what to look for when considering a charter school for your child.

10 Reasons Why High School Sports Benefit Students
Discover the 10 compelling reasons why high school sports are beneficial for students. This comprehensive article explores how athletics enhance academic performance, foster personal growth, and develop crucial life skills. From improved fitness and time management to leadership development and community representation, learn why participating in high school sports can be a game-changer for students' overall success and well-being.

February 05, 2025
Understanding the U.S. Department of Education: Structure, Impact, and EvolutionWe explore how the Department of Education shapes American education, from its cabinet-level leadership to its impact on millions of students, written for general audiences seeking clarity on this vital institution.


