Top Rankings
Berkeley 01 School District ranks among the top 20% of public school district in South Carolina for:
Category
Attribute
Diversity
Most diverse schools (Top 1%)
Community Size
Largest student body (number of students) (Top 1%)
For the 2025 school year, there are 37 public elementary schools serving 27,029 students in Berkeley 01 School District. This district's average elementary testing ranking is 5/10, which is in the bottom 50% of public elementary schools in South Carolina.
Public Elementary Schools in Berkeley 01 School District have an average math proficiency score of 31% (versus the South Carolina public elementary school average of 39%), and reading proficiency score of 44% (versus the 47% statewide average).
Minority enrollment is 52% of the student body (majority Black), which is less than the South Carolina public elementary school average of 53% (majority Black).
Overview
This School District
This State (SC)
# Schools
46 Schools
965 Schools
# Students
39,145 Students
551,243 Students
# Teachers
2,373 Teachers
39,892 Teachers
Student : Teacher Ratio
16:1
16:1
District Rank
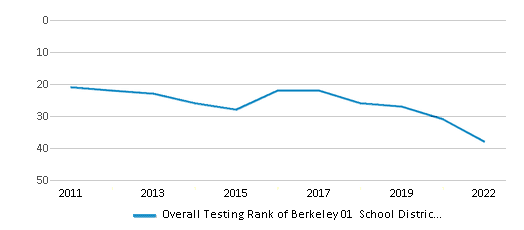
Berkeley 01 School District, which is ranked within the top 50% of all 76 school districts in South Carolina (based off of combined math and reading proficiency testing data) for the 2021-2022 school year.
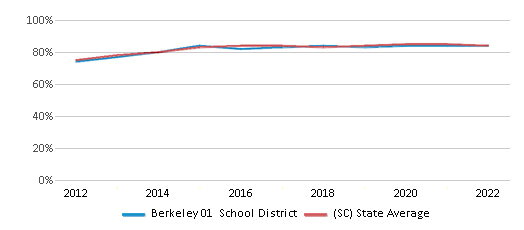
The school district's graduation rate of 84% has increased from 83% over five school years.
Overall District Rank
#38 out of 81 school districts
(Top 50%)
(Top 50%)
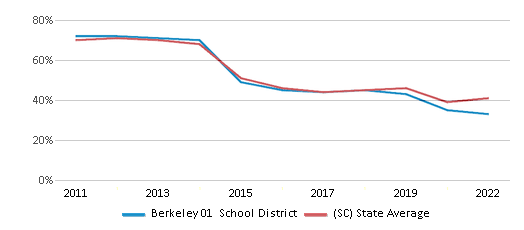
Math Test Scores (% Proficient)
33%
41%
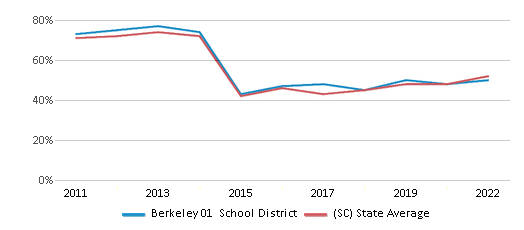
Reading/Language Arts Test Scores (% Proficient)
50%
52%
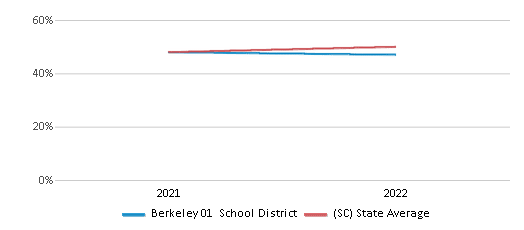
Science Test Scores (% Proficient)
47%
50%
Graduation Rate
84%
84%
Students by Ethnicity:
Diversity Score
0.68
0.67
# American Indian Students
170 Students
1,609 Students
% American Indian Students
n/a
n/a
# Asian Students
564 Students
10,166 Students
% Asian Students
1%
2%
# Hispanic Students
5,699 Students
74,117 Students
% Hispanic Students
15%
13%
# Black Students
10,676 Students
170,518 Students
% Black Students
27%
31%
# White Students
18,242 Students
258,372 Students
% White Students
47%
47%
# Hawaiian Students
42 Students
663 Students
% Hawaiian Students
n/a
n/a
# Two or more races Students
3,752 Students
35,675 Students
% of Two or more races Students
10%
7%
Students by Grade:
# Students in PK Grade:
1,281
24,436
# Students in K Grade:
2,767
53,057
# Students in 1st Grade:
2,834
56,847
# Students in 2nd Grade:
2,920
58,232
# Students in 3rd Grade:
2,834
57,411
# Students in 4th Grade:
2,967
57,861
# Students in 5th Grade:
2,854
58,020
# Students in 6th Grade:
2,913
58,906
# Students in 7th Grade:
2,829
54,750
# Students in 8th Grade:
2,922
55,491
# Students in 9th Grade:
3,623
4,594
# Students in 10th Grade:
2,710
4,219
# Students in 11th Grade:
2,976
3,860
# Students in 12th Grade:
2,715
3,559
# Ungraded Students:
-
-
District Revenue and Spending
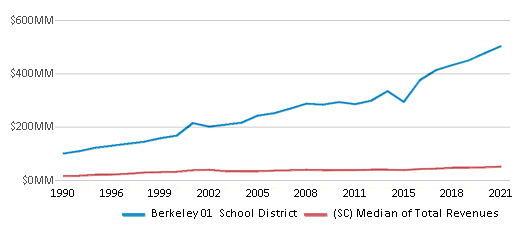
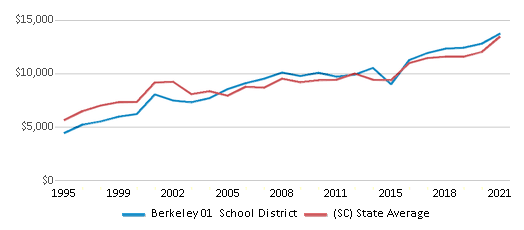
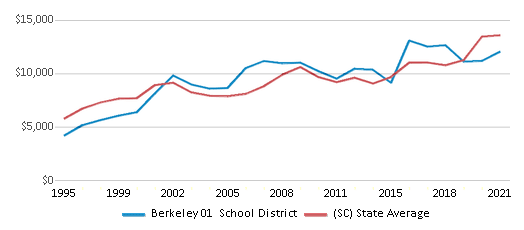
The revenue/student of $12,839 in this school district is less than the state median of $15,220. The school district revenue/student has declined by 6% over four school years.
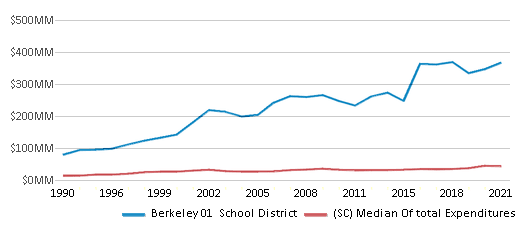
The school district's spending/student of $11,251 is less than the state median of $14,817. The school district spending/student has declined by 6% over four school years.
Total Revenue
$503 MM
$12,084 MM
Spending
$440 MM
$11,764 MM
Revenue / Student
$12,839
$15,220
Spending / Student
$11,251
$14,817
Best Berkeley 01 School District Public Elementary Schools (2025)
School
(Math and Reading Proficiency)
(Math and Reading Proficiency)
Location
Grades
Students
Rank: #11.
Daniel Island School
(Math: 75% | Reading: 83%)
Rank:
Rank:
10/
Top 10%10
2365 Daniel Island Drive
Charleston, SC 29492
(843) 471-2301
Charleston, SC 29492
(843) 471-2301
Grades: K-8
| 1,146 students
Rank: #22.
Howe Hall Aims Elementary School
Magnet School
(Math: 60% | Reading: 80%)
Rank:
Rank:
9/
Top 20%10
115 Howe Hall Road
Goose Creek, SC 29445
(843) 820-3899
Goose Creek, SC 29445
(843) 820-3899
Grades: K-5
| 418 students
Rank: #33.
Philip Simmons Elementary School
(Math: 50-54% | Reading: 65-69%)
Rank:
Rank:
8/
Top 30%10
2095 Seven Sticks Drive
Charleston, SC 29492
(843) 471-2580
Charleston, SC 29492
(843) 471-2580
Grades: PK-4
| 545 students
Rank: #44.
Marrington Middle School Of The Arts
Magnet School
(Math: 47% | Reading: 73%)
Rank:
Rank:
8/
Top 30%10
109 Gearing Street
Goose Creek, SC 29445
(843) 572-0313
Goose Creek, SC 29445
(843) 572-0313
Grades: 6-8
| 400 students
Rank: #55.
Bowen's Corner Elementary School
(Math: 55% | Reading: 60%)
Rank:
Rank:
8/
Top 30%10
1173 Williams Lane
Moncks Corner, SC 29461
(843) 572-5567
Moncks Corner, SC 29461
(843) 572-5567
Grades: PK-5
| 762 students
Rank: #66.
Marrington Elementary School
(Math: 45-49% | Reading: 65-69%)
Rank:
Rank:
7/
Top 50%10
101 Gearing Street
Goose Creek, SC 29445
(843) 572-3373
Goose Creek, SC 29445
(843) 572-3373
Grades: PK-5
| 448 students
Rank: #77.
Nexton Elementary School
(Math: 50% | Reading: 56%)
Rank:
Rank:
7/
Top 50%10
200 Scholar Way
Summerville, SC 29483
(843) 900-3222
Summerville, SC 29483
(843) 900-3222
Grades: PK-5
| 973 students
Rank: #88.
Cane Bay Elementary School
(Math: 51% | Reading: 53%)
Rank:
Rank:
7/
Top 50%10
1247 Cane Bay Boulevard
Summerville, SC 29486
(843) 899-5100
Summerville, SC 29486
(843) 899-5100
Grades: PK-4
| 1,226 students
Rank: #99.
Westview Elementary School
(Math: 44% | Reading: 50%)
Rank:
Rank:
6/
Top 50%10
100 Westview Boulevard
Goose Creek, SC 29445
(843) 797-2992
Goose Creek, SC 29445
(843) 797-2992
Grades: 3-5
| 527 students
Rank: #1010.
Foxbank Elementary School
(Math: 38% | Reading: 46%)
Rank:
Rank:
5/
Bottom 50%10
169 Foxbank Plantation Drive
Moncks Corner, SC 29461
(843) 761-1120
Moncks Corner, SC 29461
(843) 761-1120
Grades: PK-5
| 1,061 students
Rank: #1111.
Hanahan Elementary School
(Math: 38% | Reading: 45%)
Rank:
Rank:
5/
Bottom 50%10
4000 Railroad Avenue
Hanahan, SC 29410
(843) 553-3290
Hanahan, SC 29410
(843) 553-3290
Grades: PK-5
| 998 students
Rank: #1212.
Hanahan Middle School
(Math: 34% | Reading: 48%)
Rank:
Rank:
5/
Bottom 50%10
5815 Murray Drive
Hanahan, SC 29410
(843) 820-3800
Hanahan, SC 29410
(843) 820-3800
Grades: 6-8
| 781 students
Rank: #1313.
Henry E. Bonner Elementary School
(Math: 36% | Reading: 43%)
Rank:
Rank:
4/
Bottom 50%10
171 Macedonia Foxes Circle
Moncks Corner, SC 29461
(843) 899-8950
Moncks Corner, SC 29461
(843) 899-8950
Grades: PK-5
| 822 students
Rank: #1414.
Philip Simmons Middle School
(Math: 27% | Reading: 50%)
Rank:
Rank:
4/
Bottom 50%10
2065 Seven Sticks Drive
Charleston, SC 29492
(843) 471-2590
Charleston, SC 29492
(843) 471-2590
Grades: 5-8
| 454 students
Rank: #1515.
Cane Bay Middle School
(Math: 29% | Reading: 48%)
Rank:
Rank:
4/
Bottom 50%10
1175 Cane Bay Boulevard
Summerville, SC 29486
(843) 899-1857
Summerville, SC 29486
(843) 899-1857
Grades: 5-8
| 1,475 students
Rank: #1616.
Boulder Bluff Elementary School
(Math: 37% | Reading: 37%)
Rank:
Rank:
4/
Bottom 50%10
400 Judy Drive
Goose Creek, SC 29445
(843) 553-1223
Goose Creek, SC 29445
(843) 553-1223
Grades: PK-5
| 663 students
Rank: #1717.
Westview Middle School
(Math: 29% | Reading: 45%)
Rank:
Rank:
4/
Bottom 50%10
101 Westview Boulevard
Goose Creek, SC 29445
(843) 572-1700
Goose Creek, SC 29445
(843) 572-1700
Grades: 6-8
| 834 students
Rank: #1818.
Sangaree Intermediate
(Math: 30% | Reading: 39%)
Rank:
Rank:
4/
Bottom 50%10
201 School House Lane
Summerville, SC 29483
(843) 820-3850
Summerville, SC 29483
(843) 820-3850
Grades: 3-5
| 531 students
Rank: #1919.
Devon Forest Elementary School
(Math: 33% | Reading: 36%)
Rank:
Rank:
3/
Bottom 50%10
1127 Dorothy Street
Johns Island, SC 29455
(843) 820-3880
Johns Island, SC 29455
(843) 820-3880
Grades: PK-5
| 938 students
Rank: #2020.
Whitesville Elementary School
(Math: 30% | Reading: 38%)
Rank:
Rank:
3/
Bottom 50%10
324 Gaillard Road
Moncks Corner, SC 29461
(843) 899-8880
Moncks Corner, SC 29461
(843) 899-8880
Grades: PK-5
| 1,096 students
Rank: #2121.
Cross Elementary School
(Math: 20-24% | Reading: 40-44%)
Rank:
Rank:
3/
Bottom 50%10
1325 Ranger Drive
Cross, SC 29436
(843) 899-8916
Cross, SC 29436
(843) 899-8916
Grades: PK-6
| 382 students
Rank: #2222.
Mount Holly Elementary School
(Math: 26% | Reading: 37%)
Rank:
Rank:
3/
Bottom 50%10
225 Garwood Drive
Goose Creek, SC 29445
(843) 820-4090
Goose Creek, SC 29445
(843) 820-4090
Grades: PK-5
| 576 students
Rank: #2323.
Moncks Corner Elementary School
(Math: 27% | Reading: 33%)
Rank:
Rank:
3/
Bottom 50%10
777 Stony Landing Road
Moncks Corner, SC 29461
(843) 899-8870
Moncks Corner, SC 29461
(843) 899-8870
Grades: PK-5
| 659 students
Rank: #2424.
Macedonia Middle School
(Math: 18% | Reading: 40%)
Rank:
Rank:
3/
Bottom 50%10
200 Macedonia Foxes Circle
Moncks Corner, SC 29461
(843) 899-8940
Moncks Corner, SC 29461
(843) 899-8940
Grades: 6-8
| 403 students
Rank: #2525.
Sangaree Middle School
(Math: 20% | Reading: 37%)
Rank:
Rank:
3/
Bottom 50%10
1050 Discovery Drive
Goose Creek, SC 29445
(843) 821-4028
Goose Creek, SC 29445
(843) 821-4028
Grades: 6-8
| 680 students
Rank: #2626.
Berkeley Middle School
(Math: 19% | Reading: 37%)
Rank:
Rank:
2/
Bottom 50%10
320 North Live Oak Drive
Moncks Corner, SC 29461
(843) 899-8840
Moncks Corner, SC 29461
(843) 899-8840
Grades: 6-8
| 1,345 students
Rank: #2727.
St. Stephen Elementary School
(Math: 20-24% | Reading: 30-34%)
Rank:
Rank:
2/
Bottom 50%10
1053 Russellville Road
Saint Stephen, SC 29479
(843) 567-2813
Saint Stephen, SC 29479
(843) 567-2813
Grades: PK-5
| 326 students
Rank: #2828.
College Park Middle School
(Math: 12% | Reading: 27%)
Rank:
Rank:
2/
Bottom 50%10
713 College Park Road
Ladson, SC 29456
(843) 553-8300
Ladson, SC 29456
(843) 553-8300
Grades: 6-8
| 692 students
Rank: #2929.
St. Stephen Middle School
(Math: 9% | Reading: 31%)
Rank:
Rank:
1/
Bottom 50%10
225 Carolina Avenue
Saint Stephen, SC 29479
(843) 567-3128
Saint Stephen, SC 29479
(843) 567-3128
Grades: 6-8
| 182 students
Rank: #3030.
Goose Creek Elementary School
(Math: 17% | Reading: 22%)
Rank:
Rank:
1/
Bottom 50%10
200 Foster Creek Road
Goose Creek, SC 29445
(843) 820-8008
Goose Creek, SC 29445
(843) 820-8008
Grades: PK-5
| 928 students
Rank: #3131.
Sedgefield Middle School
(Math: 10% | Reading: 27%)
Rank:
Rank:
1/
Bottom 50%10
131 Charles B. Gibson Boulevar
Goose Creek, SC 29445
(843) 797-2620
Goose Creek, SC 29445
(843) 797-2620
Grades: 6-8
| 948 students
Rank: #3232.
College Park Elementary School
(Math: 13% | Reading: 25%)
Rank:
Rank:
1/
Bottom 50%10
100 Davidson Drive
Ladson, SC 29456
(843) 797-2711
Ladson, SC 29456
(843) 797-2711
Grades: PK-5
| 819 students
Rank: #3333.
Cainhoy Elementary School
(Math: 10-14% | Reading: 20-24%)
Rank:
Rank:
1/
Bottom 50%10
2434 Cainhoy Road
Huger, SC 29450
(843) 899-8975
Huger, SC 29450
(843) 899-8975
Grades: PK-5
| 157 students
Rank: n/an/a
715 Highway 6
Moncks Corner, SC 29461
(843) 899-8860
Moncks Corner, SC 29461
(843) 899-8860
Grades: PK-5
| 635 students
Rank: n/an/a
380 Coleridge Drive
Summerville, SC 29486
(843) 900-3302
Summerville, SC 29486
(843) 900-3302
Grades: PK-8
| 940 students
Show 2 more public schools in Berkeley 01 School District (out of 37 total schools)
Loading...
Recent Articles

What Is A Charter School?
Explore the world of charter schools in this comprehensive guide. Learn about their history, how they operate, and the pros and cons of this educational innovation. Discover key facts about charter schools, including admission policies, demographics, and funding, as well as what to look for when considering a charter school for your child.

10 Reasons Why High School Sports Benefit Students
Discover the 10 compelling reasons why high school sports are beneficial for students. This comprehensive article explores how athletics enhance academic performance, foster personal growth, and develop crucial life skills. From improved fitness and time management to leadership development and community representation, learn why participating in high school sports can be a game-changer for students' overall success and well-being.

February 05, 2025
Understanding the U.S. Department of Education: Structure, Impact, and EvolutionWe explore how the Department of Education shapes American education, from its cabinet-level leadership to its impact on millions of students, written for general audiences seeking clarity on this vital institution.


