Top Rankings
Charter Institute At Erskine School District ranks among the top 20% of public school district in South Carolina for:
Category
Attribute
Community Size
Largest student body (number of students) (Top 1%)
For the 2025 school year, there are 19 public high schools serving 21,770 students in Charter Institute At Erskine School District. This district's average high testing ranking is 1/10, which is in the bottom 50% of public high schools in South Carolina.
Public High Schools in Charter Institute At Erskine School District have an average math proficiency score of 31% (versus the South Carolina public high school average of 51%), and reading proficiency score of 56% (versus the 77% statewide average).
Public High School in Charter Institute At Erskine School District have a Graduation Rate of 82%, which is less than the South Carolina average of 84%.
The school with highest graduation rate is Brashier Middle College Charter High School, with ≥95% graduation rate. Read more about public school graduation rate statistics in South Carolina or national school graduation rate statistics.
Minority enrollment is 40% of the student body (majority Black), which is less than the South Carolina public high school average of 52% (majority Black).
Overview
This School District
This State (SC)
# Schools
27 Schools
329 Schools
# Students
25,153 Students
267,758 Students
# Teachers
1,459 Teachers
17,613 Teachers
Student : Teacher Ratio
17:1
17:1
District Rank
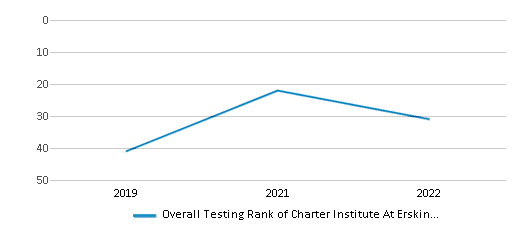
Charter Institute At Erskine School District, which is ranked within the top 50% of all 76 school districts in South Carolina (based off of combined math and reading proficiency testing data) for the 2021-2022 school year.
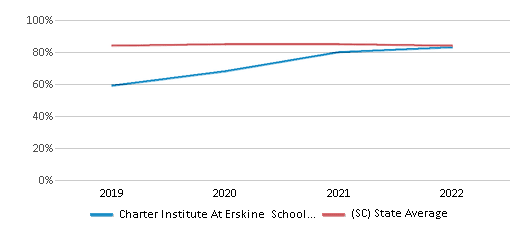
The school district's graduation rate of 83% has increased from 59% over five school years.
Overall District Rank
#31 out of 81 school districts
(Top 50%)
(Top 50%)
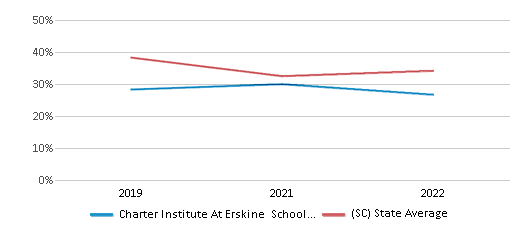
Math Test Scores (% Proficient)
32%
41%
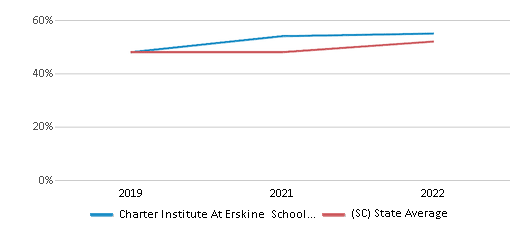
Reading/Language Arts Test Scores (% Proficient)
55%
52%
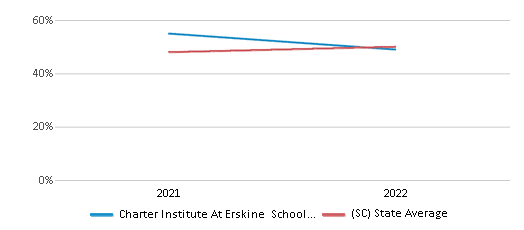
Science Test Scores (% Proficient)
49%
50%
Graduation Rate
83%
84%
Students by Ethnicity:
Diversity Score
0.59
0.65
# American Indian Students
97 Students
804 Students
% American Indian Students
1%
n/a
# Asian Students
228 Students
4,596 Students
% Asian Students
1%
2%
# Hispanic Students
2,338 Students
34,801 Students
% Hispanic Students
9%
13%
# Black Students
6,108 Students
84,595 Students
% Black Students
24%
32%
# White Students
14,829 Students
129,255 Students
% White Students
59%
48%
# Hawaiian Students
25 Students
313 Students
% Hawaiian Students
n/a
n/a
# Two or more races Students
1,478 Students
13,370 Students
% of Two or more races Students
6%
5%
Students by Grade:
# Students in PK Grade:
89
112
# Students in K Grade:
1,313
1,598
# Students in 1st Grade:
1,363
1,677
# Students in 2nd Grade:
1,400
1,708
# Students in 3rd Grade:
1,435
1,675
# Students in 4th Grade:
1,440
1,708
# Students in 5th Grade:
1,447
1,814
# Students in 6th Grade:
1,864
3,526
# Students in 7th Grade:
1,958
3,977
# Students in 8th Grade:
2,207
4,422
# Students in 9th Grade:
2,930
71,959
# Students in 10th Grade:
2,813
63,852
# Students in 11th Grade:
2,576
57,101
# Students in 12th Grade:
2,318
52,629
# Ungraded Students:
-
-
District Revenue and Spending
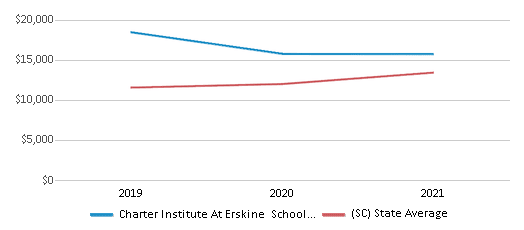
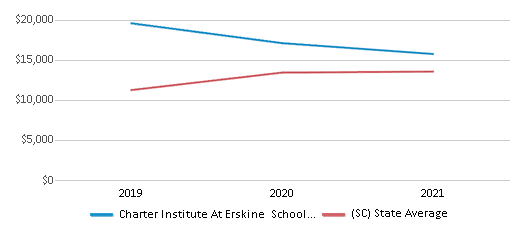
The revenue/student of $14,874 in this school district is less than the state median of $15,220. The school district revenue/student has declined by 5% over four school years.
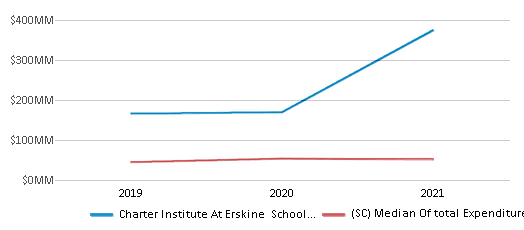
The school district's spending/student of $14,896 is higher than the state median of $14,817. The school district spending/student has declined by 5% over four school years.
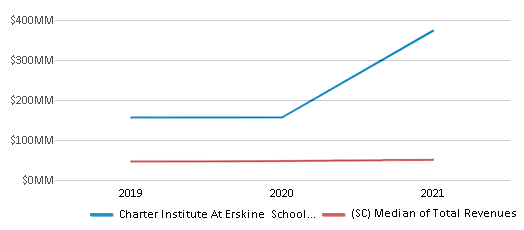
Total Revenue
$374 MM
$12,084 MM
Spending
$375 MM
$11,764 MM
Revenue / Student
$14,874
$15,220
Spending / Student
$14,896
$14,817
Best Charter Institute At Erskine School District Public High Schools (2025)
School
(Math and Reading Proficiency)
(Math and Reading Proficiency)
Location
Grades
Students
Rank: #1 - 21. - 2.
Brashier Middle College Charter High School
Charter School
(Math: ≥95% | Reading: ≥95%)
Rank:
Rank:
10/
Top 1%10
1830 West Georgia Road Buildin
Simpsonville, SC 29680
(864) 757-1800
Simpsonville, SC 29680
(864) 757-1800
Grades: 9-12
| 484 students
Rank: #1 - 21. - 2.
Oceanside Collegiate Academy
Charter School
(Math: ≥95% | Reading: ≥95%)
Rank:
Rank:
10/
Top 1%10
580 Faison Road
Mount Pleasant, SC 29466
(843) 936-7128
Mount Pleasant, SC 29466
(843) 936-7128
Grades: 9-12
| 653 students
Rank: #33.
Legion Collegiate Academy
Charter School
(Math: 60-69% | Reading: ≥95%)
Rank:
Rank:
10/
Top 10%10
505 University Drive
Rock Hill, SC 29730
(803) 620-6040
Rock Hill, SC 29730
(803) 620-6040
Grades: 9-12
| 602 students
Rank: #44.
Gray Collegiate Academy
Charter School
(Math: 65-69% | Reading: 83%)
Rank:
Rank:
10/
Top 10%10
3833 Leaphart Road
West Columbia, SC 29169
(803) 951-3321
West Columbia, SC 29169
(803) 951-3321
Grades: 6-12
| 869 students
Rank: #55.
Lowcountry Leadership Charter School
Charter School
(Math: 48% | Reading: 62%)
Rank:
Rank:
7/
Top 50%10
5139 Gibson Road
Hollywood, SC 29449
(843) 889-5527
Hollywood, SC 29449
(843) 889-5527
Grades: K-12
| 537 students
Rank: #66.
Odyssey Online Learning
Charter School
(Math: 30-39% | Reading: 75-79%)
Rank:
Rank:
7/
Top 50%10
510 Lexington Ave #102
Chapin, SC 29036
(803) 735-9110
Chapin, SC 29036
(803) 735-9110
Grades: 9-12
| 452 students
Rank: #77.
Thornwell Charter School
Charter School
(Math: 45-49% | Reading: 45-49%)
Rank:
Rank:
6/
Top 50%10
203 West Calhoun Street
Clinton, SC 29325
(864) 808-0801
Clinton, SC 29325
(864) 808-0801
Grades: K-11
| 371 students
Rank: #88.
The South Carolina Preparatory Academy
Charter School
(Math: 30-34% | Reading: 60-64%)
Rank:
Rank:
6/
Top 50%10
1650 E. Greenville St. Suite H
Anderson, SC 29621
(864) 923-6909
Anderson, SC 29621
(864) 923-6909
Grades: 6-12
| 692 students
Rank: #99.
Sc Connections Academy
Charter School
(Math: 31% | Reading: 62%)
Rank:
Rank:
6/
Top 50%10
201 Executive Center Drive Sui
Columbia, SC 29210
(803) 212-4712
Columbia, SC 29210
(803) 212-4712
Grades: K-12
| 5,955 students
Rank: #1010.
South Carolina Virtual Charter School
Charter School
(Math: 30% | Reading: 55%)
Rank:
Rank:
5/
Bottom 50%10
2023 Platt Springs Road
West Columbia, SC 29169
(803) 253-6222
West Columbia, SC 29169
(803) 253-6222
Grades: K-12
| 2,350 students
Rank: #11 - 1211. - 12.
Lowcountry Connection Academy
Charter School
(Math: 20-24% | Reading: 50-54%)
Rank:
Rank:
4/
Bottom 50%10
1520 Old Trolley Road
Summerville, SC 29485
(843) 695-9305
Summerville, SC 29485
(843) 695-9305
Grades: K-12
| 697 students
Rank: #11 - 1211. - 12.
Midlands Stem Institute
Charter School
(Math: 20-24% | Reading: 50-54%)
Rank:
Rank:
4/
Bottom 50%10
112 Crane Street
Winnsboro, SC 29180
(803) 815-1524
Winnsboro, SC 29180
(803) 815-1524
Grades: PK-12
| 247 students
Rank: #1313.
Virtus Academy Of South Carolina
Charter School
(Math: 27% | Reading: 40%)
Rank:
Rank:
3/
Bottom 50%10
2407 Pisgah Road
Florence, SC 29501
(843) 799-4032
Florence, SC 29501
(843) 799-4032
Grades: K-10
| 686 students
Rank: #1414.
Cyber Academy Of South Carolina
Charter School
(Math: 23% | Reading: 44%)
Rank:
Rank:
3/
Bottom 50%10
330 Pelham Road Suite 101a
Greenville, SC 29615
(855) 611-2830
Greenville, SC 29615
(855) 611-2830
Grades: K-12
| 3,493 students
Rank: #1515.
Calhoun Falls Charter School
Charter School
(Math: 30-34% | Reading: 30-34%)
Rank:
Rank:
3/
Bottom 50%10
205 Edgefield Street
Calhoun Falls, SC 29628
(864) 418-8014
Calhoun Falls, SC 29628
(864) 418-8014
Grades: 6-12
| 164 students
Rank: #1616.
Royal Live Oaks Academy Of The Arts And Sciences Charter School
Charter School
(Math: 25% | Reading: 41%)
Rank:
Rank:
3/
Bottom 50%10
400 John Smith Road
Hardeeville, SC 29927
(843) 784-2630
Hardeeville, SC 29927
(843) 784-2630
Grades: K-12
| 666 students
Rank: #1717.
Clear Dot Charter School
Charter School
(Math: 10-14% | Reading: 30-34%)
Rank:
Rank:
2/
Bottom 50%10
2015 Marion Street
Columbia, SC 29201
(803) 567-3075
Columbia, SC 29201
(803) 567-3075
Grades: PK-10
| 418 students
Rank: n/an/a
109 Innovation Drive
Lexington, SC 29072
(803) 756-2724
Lexington, SC 29072
(803) 756-2724
Grades: K-12
| 1,728 students
Rank: n/an/a
Heron Virtual Academy Of South Carolina
Charter School
330 Pelham Road Suite101-a (te
Greenville, SC 29615
(803) 849-2464
Greenville, SC 29615
(803) 849-2464
Grades: 9-12
| 706 students
Recent Articles

Navigating Special Needs Education: A Comprehensive Guide for Parents and Educators
We explore special needs in children, including learning disabilities, autism, and ADHD. We suggest some insights on diagnosis, support strategies, and educational approaches, empowering parents and educators to provide effective assistance to children with special needs.

Sexual Harassment at Age 6: The Tale of a First Grade Suspension
A six-year old in Aurora, Colorado, was suspended after singing an LMFAO song to a little girl in his class and reportedly “shaking his booty.” We look at the case and the sexual harassment problem in public schools today.

February 05, 2025
Understanding the U.S. Department of Education: Structure, Impact, and EvolutionWe explore how the Department of Education shapes American education, from its cabinet-level leadership to its impact on millions of students, written for general audiences seeking clarity on this vital institution.


