Top Rankings
Greenville 01 School District ranks among the top 20% of public school district in South Carolina for:
Category
Attribute
Overall Rank
Highest overall rank (Top 10%)
Math Proficiency
Highest math proficiency (Top 10%)
Reading/Language Arts Proficiency
Highest reading/language arts proficiency (Top 10%)
Science Proficiency
Highest science proficiency (Top 10%)
Diversity
Most diverse schools (Top 1%)
Community Size
Largest student body (number of students) (Top 1%)
For the 2025 school year, there are 37 public preschools serving 25,315 students in Greenville 01 School District. This district's average pre testing ranking is 10/10, which is in the top 10% of public pre schools in South Carolina.
Public Preschools in Greenville 01 School District have an average math proficiency score of 58% (versus the South Carolina public pre school average of 45%), and reading proficiency score of 57% (versus the 48% statewide average).
Minority enrollment is 55% of the student body (majority Black and Hispanic), which is more than the South Carolina public preschool average of 54% (majority Black).
Overview
This School District
This State (SC)
# Schools
93 Schools
578 Schools
# Students
78,371 Students
307,049 Students
# Teachers
5,040 Teachers
22,837 Teachers
Student : Teacher Ratio
16:1
16:1
District Rank
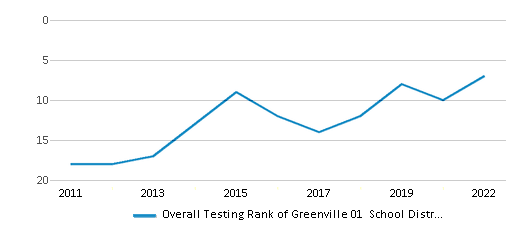
Greenville 01 School District, which is ranked within the top 10% of all 76 school districts in South Carolina (based off of combined math and reading proficiency testing data) for the 2021-2022 school year.
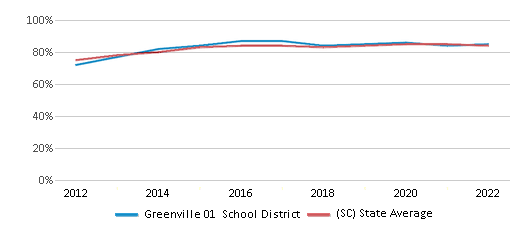
The school district's graduation rate of 85% has decreased from 87% over five school years.
Overall District Rank
#7 out of 81 school districts
(Top 10%)
(Top 10%)
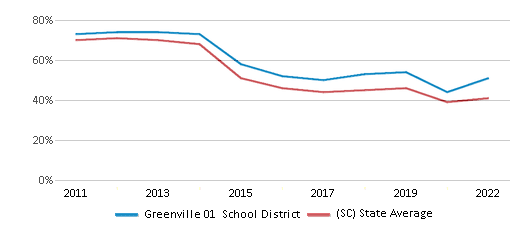
Math Test Scores (% Proficient)
51%
41%
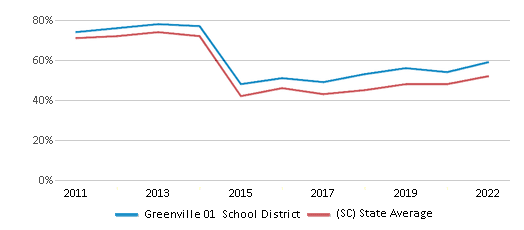
Reading/Language Arts Test Scores (% Proficient)
59%
52%
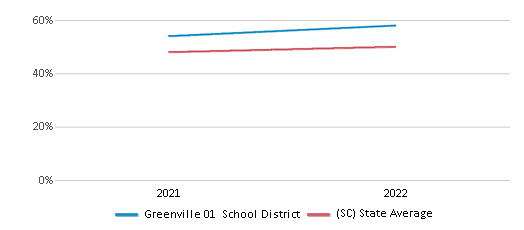
Science Test Scores (% Proficient)
58%
50%
Graduation Rate
85%
84%
Students by Ethnicity:
Diversity Score
0.67
0.67
# American Indian Students
245 Students
905 Students
% American Indian Students
n/a
n/a
# Asian Students
1,885 Students
4,942 Students
% Asian Students
3%
1%
# Hispanic Students
16,353 Students
41,883 Students
% Hispanic Students
21%
14%
# Black Students
17,500 Students
97,124 Students
% Black Students
22%
32%
# White Students
38,523 Students
140,483 Students
% White Students
49%
46%
# Hawaiian Students
136 Students
402 Students
% Hawaiian Students
n/a
n/a
# Two or more races Students
3,729 Students
21,254 Students
% of Two or more races Students
5%
7%
Students by Grade:
# Students in PK Grade:
1,884
27,258
# Students in K Grade:
5,417
46,285
# Students in 1st Grade:
5,946
47,365
# Students in 2nd Grade:
6,007
48,243
# Students in 3rd Grade:
5,883
43,895
# Students in 4th Grade:
5,861
43,663
# Students in 5th Grade:
5,755
40,854
# Students in 6th Grade:
5,830
3,355
# Students in 7th Grade:
5,961
2,477
# Students in 8th Grade:
5,901
2,190
# Students in 9th Grade:
6,777
439
# Students in 10th Grade:
6,353
373
# Students in 11th Grade:
5,565
325
# Students in 12th Grade:
5,231
327
# Ungraded Students:
-
-
District Revenue and Spending
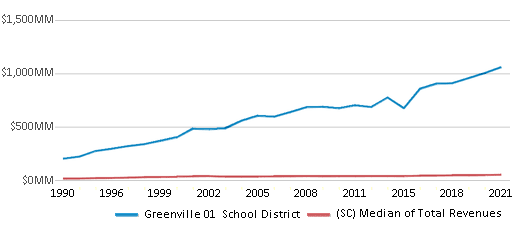
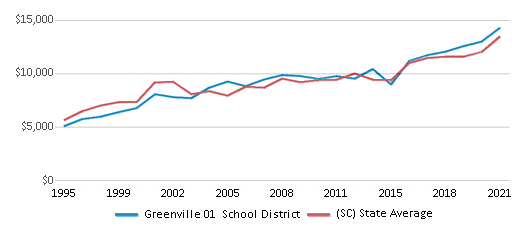
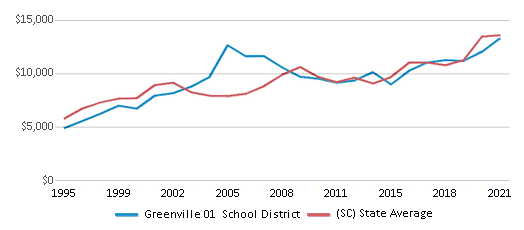
The revenue/student of $13,506 in this school district is less than the state median of $15,220. The school district revenue/student has declined by 5% over four school years.
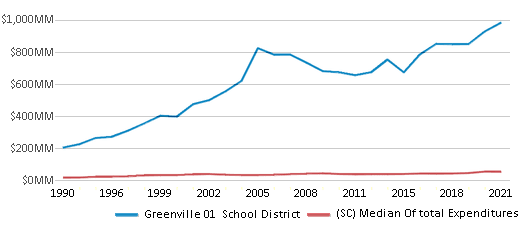
The school district's spending/student of $12,556 is less than the state median of $14,817. The school district spending/student has declined by 5% over four school years.
Total Revenue
$1,059 MM
$12,084 MM
Spending
$984 MM
$11,764 MM
Revenue / Student
$13,506
$15,220
Spending / Student
$12,556
$14,817
Best Greenville 01 School District Public Preschools (2025)
School
(Math and Reading Proficiency)
(Math and Reading Proficiency)
Location
Grades
Students
Rank: #11.
Sterling School
(Math: 87% | Reading: 89%)
Rank:
Rank:
10/
Top 5%10
99 John Mccarroll Way
Greenville, SC 29607
(864) 355-4480
Greenville, SC 29607
(864) 355-4480
Grades: PK-8
| 713 students
Rank: #22.
Tigerville Elementary School
(Math: 80-84% | Reading: 80-84%)
Rank:
Rank:
10/
Top 5%10
25 Tigerville Elementary Schoo
Taylors, SC 29687
(864) 355-4600
Taylors, SC 29687
(864) 355-4600
Grades: PK-5
| 280 students
Rank: #33.
Monarch Elementary School
(Math: 75% | Reading: 80%)
Rank:
Rank:
10/
Top 10%10
224 Five Forks Road
Simpsonville, SC 29681
(864) 355-0600
Simpsonville, SC 29681
(864) 355-0600
Grades: PK-5
| 882 students
Rank: #44.
Oakview Elementary School
(Math: 76% | Reading: 77%)
Rank:
Rank:
10/
Top 10%10
515 Godfrey Road
Simpsonville, SC 29681
(864) 355-7100
Simpsonville, SC 29681
(864) 355-7100
Grades: PK-5
| 855 students
Rank: #55.
Paris Elementary School
(Math: 73% | Reading: 74%)
Rank:
Rank:
9/
Top 20%10
32 East Belvue Road
Taylors, SC 29687
(864) 355-4260
Taylors, SC 29687
(864) 355-4260
Grades: PK-5
| 595 students
Rank: #66.
Woodland Elementary School
(Math: 71% | Reading: 70%)
Rank:
Rank:
9/
Top 20%10
1730 Gibb Shoals Road
Greer, SC 29650
(864) 355-0400
Greer, SC 29650
(864) 355-0400
Grades: PK-5
| 1,298 students
Rank: #7 - 87. - 8.
Mountain View Elementary School
(Math: 66% | Reading: 73%)
Rank:
Rank:
9/
Top 20%10
6350 Highway 253
Taylors, SC 29687
(864) 355-6800
Taylors, SC 29687
(864) 355-6800
Grades: PK-5
| 805 students
Rank: #7 - 87. - 8.
Skyland Elementary School
(Math: 68% | Reading: 70%)
Rank:
Rank:
9/
Top 20%10
4221 Highway 14 North
Greer, SC 29651
(864) 355-7200
Greer, SC 29651
(864) 355-7200
Grades: PK-5
| 752 students
Rank: #99.
Brushy Creek Elementary School
(Math: 67% | Reading: 68%)
Rank:
Rank:
9/
Top 20%10
1344 Brushy Creek Road
Taylors, SC 29687
(864) 355-5400
Taylors, SC 29687
(864) 355-5400
Grades: PK-5
| 841 students
Rank: #1010.
Heritage Elementary School
(Math: 68% | Reading: 66%)
Rank:
Rank:
9/
Top 20%10
1592 Greer Highway
Travelers Rest, SC 29690
(864) 355-6000
Travelers Rest, SC 29690
(864) 355-6000
Grades: PK-5
| 541 students
Rank: #11 - 1211. - 12.
A.j. Whittenberg Elementary School
(Math: 64% | Reading: 64%)
Rank:
Rank:
9/
Top 20%10
420 Westfield Street
Greenville, SC 29601
(864) 452-0500
Greenville, SC 29601
(864) 452-0500
Grades: PK-5
| 479 students
Rank: #11 - 1211. - 12.
Gateway Elementary School
(Math: 64% | Reading: 64%)
Rank:
Rank:
9/
Top 20%10
200 Hawkins Road
Travelers Rest, SC 29690
(864) 355-5200
Travelers Rest, SC 29690
(864) 355-5200
Grades: PK-5
| 648 students
Rank: #1313.
Blythe Academy
Magnet School
(Math: 63% | Reading: 62%)
Rank:
Rank:
8/
Top 30%10
100 Blythe Drive
Greenville, SC 29605
(864) 355-4400
Greenville, SC 29605
(864) 355-4400
Grades: PK-5
| 861 students
Rank: #1414.
Simpsonville Elementary School
(Math: 60% | Reading: 59%)
Rank:
Rank:
8/
Top 30%10
200 Morton Avenue
Simpsonville, SC 29681
(864) 355-8300
Simpsonville, SC 29681
(864) 355-8300
Grades: PK-5
| 774 students
Rank: #1515.
Greenbrier Elementary School
(Math: 56% | Reading: 62%)
Rank:
Rank:
8/
Top 30%10
853 Log Shoals Road
Greenville, SC 29607
(864) 355-5300
Greenville, SC 29607
(864) 355-5300
Grades: PK-5
| 839 students
Rank: #1616.
Fountain Inn Elementary School
(Math: 62% | Reading: 56%)
Rank:
Rank:
8/
Top 30%10
608 Fairview Street
Fountain Inn, SC 29644
(864) 355-5100
Fountain Inn, SC 29644
(864) 355-5100
Grades: PK-5
| 933 students
Rank: #1717.
Mauldin Elementary School
(Math: 59% | Reading: 57%)
Rank:
Rank:
8/
Top 30%10
1194 Holland Road
Simpsonville, SC 29681
(864) 355-3700
Simpsonville, SC 29681
(864) 355-3700
Grades: PK-5
| 1,052 students
Rank: #1818.
Mitchell Road Elementary School
(Math: 56% | Reading: 60%)
Rank:
Rank:
8/
Top 30%10
4124 East North Street Extensi
Greenville, SC 29615
(864) 355-6700
Greenville, SC 29615
(864) 355-6700
Grades: PK-5
| 603 students
Rank: #1919.
Bryson Elementary School
(Math: 60% | Reading: 52%)
Rank:
Rank:
7/
Top 50%10
703 Bryson Drive
Simpsonville, SC 29681
(864) 355-3600
Simpsonville, SC 29681
(864) 355-3600
Grades: PK-5
| 1,078 students
Rank: #2020.
Ellen Woodside Elementary School
(Math: 57% | Reading: 51%)
Rank:
Rank:
7/
Top 50%10
9122 Augusta Road
Pelzer, SC 29669
(864) 355-4900
Pelzer, SC 29669
(864) 355-4900
Grades: PK-5
| 1,051 students
Rank: #2121.
Lake Forest Elementary School
(Math: 51% | Reading: 52%)
Rank:
Rank:
7/
Top 50%10
16 Berkshire Avenue
Greenville, SC 29615
(864) 355-4000
Greenville, SC 29615
(864) 355-4000
Grades: PK-5
| 796 students
Rank: #2222.
Slater Marietta Elementary School
(Math: 45-49% | Reading: 50-54%)
Rank:
Rank:
6/
Top 50%10
100 Baker Circle
Marietta, SC 29661
(864) 355-2000
Marietta, SC 29661
(864) 355-2000
Grades: PK-5
| 329 students
Rank: #2323.
East North Street Academy
Magnet School
(Math: 47% | Reading: 48%)
Rank:
Rank:
6/
Top 50%10
1720 East North Street
Greenville, SC 29607
(864) 355-2900
Greenville, SC 29607
(864) 355-2900
Grades: PK-5
| 704 students
Rank: #2424.
Brook Glenn Elementary School
(Math: 40-44% | Reading: 50-54%)
Rank:
Rank:
6/
Top 50%10
2003 East Lee Road
Taylors, SC 29687
(864) 355-4700
Taylors, SC 29687
(864) 355-4700
Grades: PK-5
| 417 students
Rank: #2525.
Westcliffe Elementary School
(Math: 50-54% | Reading: 40-44%)
Rank:
Rank:
6/
Top 50%10
105 Eastbourne Road
Greenville, SC 29611
(864) 355-0300
Greenville, SC 29611
(864) 355-0300
Grades: PK-5
| 304 students
Rank: #26 - 2726. - 27.
Crestview Elementary School
(Math: 44% | Reading: 45%)
Rank:
Rank:
5/
Bottom 50%10
509 American Legion Road
Greer, SC 29651
(864) 355-2600
Greer, SC 29651
(864) 355-2600
Grades: PK-5
| 664 students
Rank: #26 - 2726. - 27.
Duncan Chapel Elementary School
(Math: 46% | Reading: 43%)
Rank:
Rank:
5/
Bottom 50%10
210 Duncan Chapel Road
Greenville, SC 29617
(864) 355-2700
Greenville, SC 29617
(864) 355-2700
Grades: PK-5
| 583 students
Rank: #2828.
Robert E. Cashion Elementary School
(Math: 43% | Reading: 44%)
Rank:
Rank:
5/
Bottom 50%10
1500 Fork Shoals Road
Greenville, SC 29605
(864) 355-8000
Greenville, SC 29605
(864) 355-8000
Grades: PK-5
| 934 students
Rank: #2929.
Chandler Creek Elementary School
(Math: 45% | Reading: 41%)
Rank:
Rank:
5/
Bottom 50%10
301 Chandler Road
Greer, SC 29651
(864) 355-2400
Greer, SC 29651
(864) 355-2400
Grades: PK-5
| 868 students
Rank: #3030.
Monaview Elementary School
(Math: 45% | Reading: 37%)
Rank:
Rank:
5/
Bottom 50%10
10 Monaview Street
Greenville, SC 29617
(864) 355-4300
Greenville, SC 29617
(864) 355-4300
Grades: PK-5
| 580 students
Rank: #3131.
Hollis Academy
(Math: 39% | Reading: 37%)
Rank:
Rank:
4/
Bottom 50%10
200 Goodrich Street
Greenville, SC 29611
(864) 355-4800
Greenville, SC 29611
(864) 355-4800
Grades: PK-5
| 572 students
Rank: #3232.
Armstrong Elementary School
(Math: 35-39% | Reading: 35-39%)
Rank:
Rank:
4/
Bottom 50%10
8601 White Horse Road
Greenville, SC 29617
(864) 355-1100
Greenville, SC 29617
(864) 355-1100
Grades: PK-5
| 415 students
Rank: #3333.
Thomas E. Kerns Elementary School
(Math: 34% | Reading: 31%)
Rank:
Rank:
3/
Bottom 50%10
6650 Frontage Road At White Ho
Greenville, SC 29605
(864) 355-1300
Greenville, SC 29605
(864) 355-1300
Grades: PK-5
| 494 students
Rank: #3434.
Cherrydale Elementary School
(Math: 30% | Reading: 26%)
Rank:
Rank:
2/
Bottom 50%10
302 Perry Road
Greenville, SC 29609
(864) 355-3300
Greenville, SC 29609
(864) 355-3300
Grades: PK-5
| 652 students
Rank: #3535.
Alexander Elementary School
(Math: 15-19% | Reading: 20-24%)
Rank:
Rank:
1/
Bottom 50%10
1601 Bramlett Road
Greenville, SC 29611
(864) 355-1000
Greenville, SC 29611
(864) 355-1000
Grades: PK-5
| 473 students
Show 2 more public schools in Greenville 01 School District (out of 37 total schools)
Loading...
Recent Articles

What Is A Charter School?
Explore the world of charter schools in this comprehensive guide. Learn about their history, how they operate, and the pros and cons of this educational innovation. Discover key facts about charter schools, including admission policies, demographics, and funding, as well as what to look for when considering a charter school for your child.

10 Reasons Why High School Sports Benefit Students
Discover the 10 compelling reasons why high school sports are beneficial for students. This comprehensive article explores how athletics enhance academic performance, foster personal growth, and develop crucial life skills. From improved fitness and time management to leadership development and community representation, learn why participating in high school sports can be a game-changer for students' overall success and well-being.

February 05, 2025
Understanding the U.S. Department of Education: Structure, Impact, and EvolutionWe explore how the Department of Education shapes American education, from its cabinet-level leadership to its impact on millions of students, written for general audiences seeking clarity on this vital institution.


