


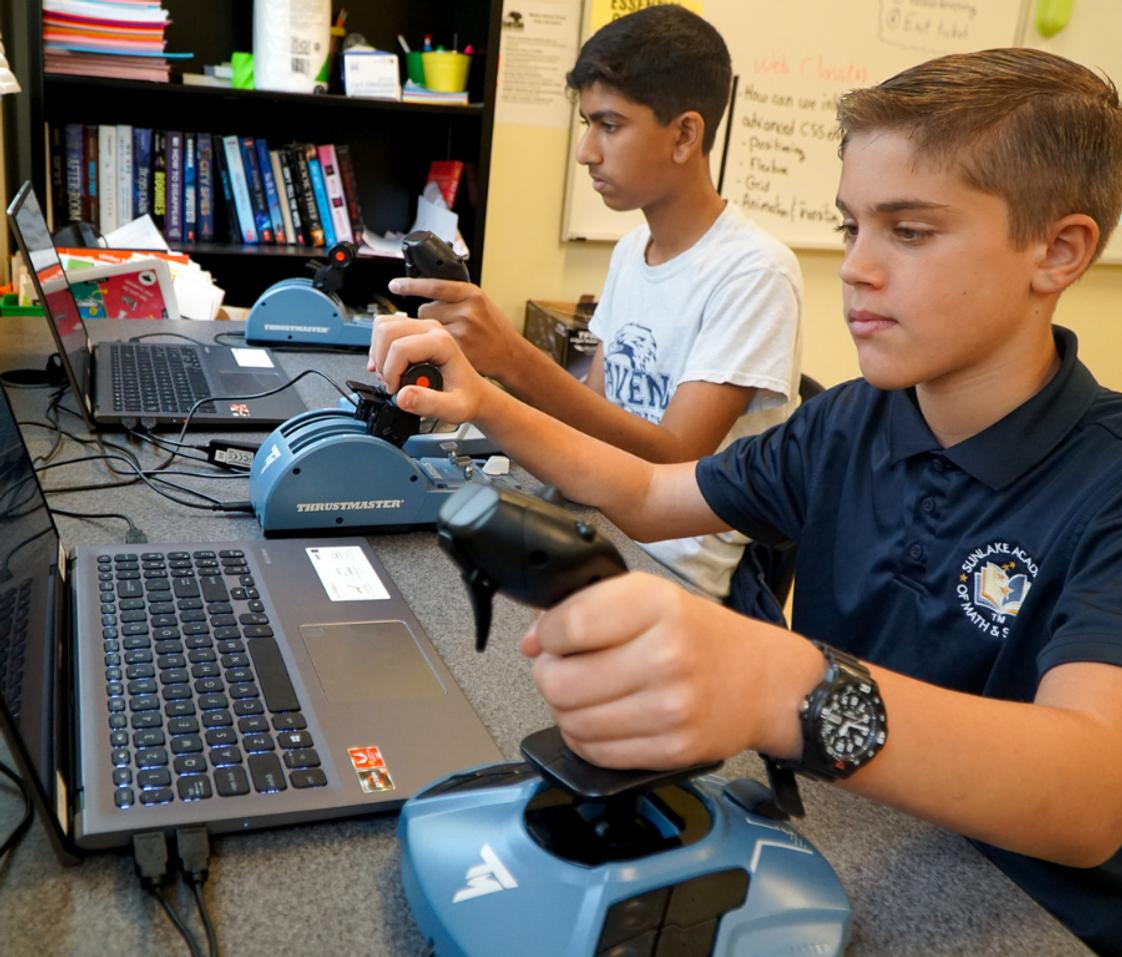
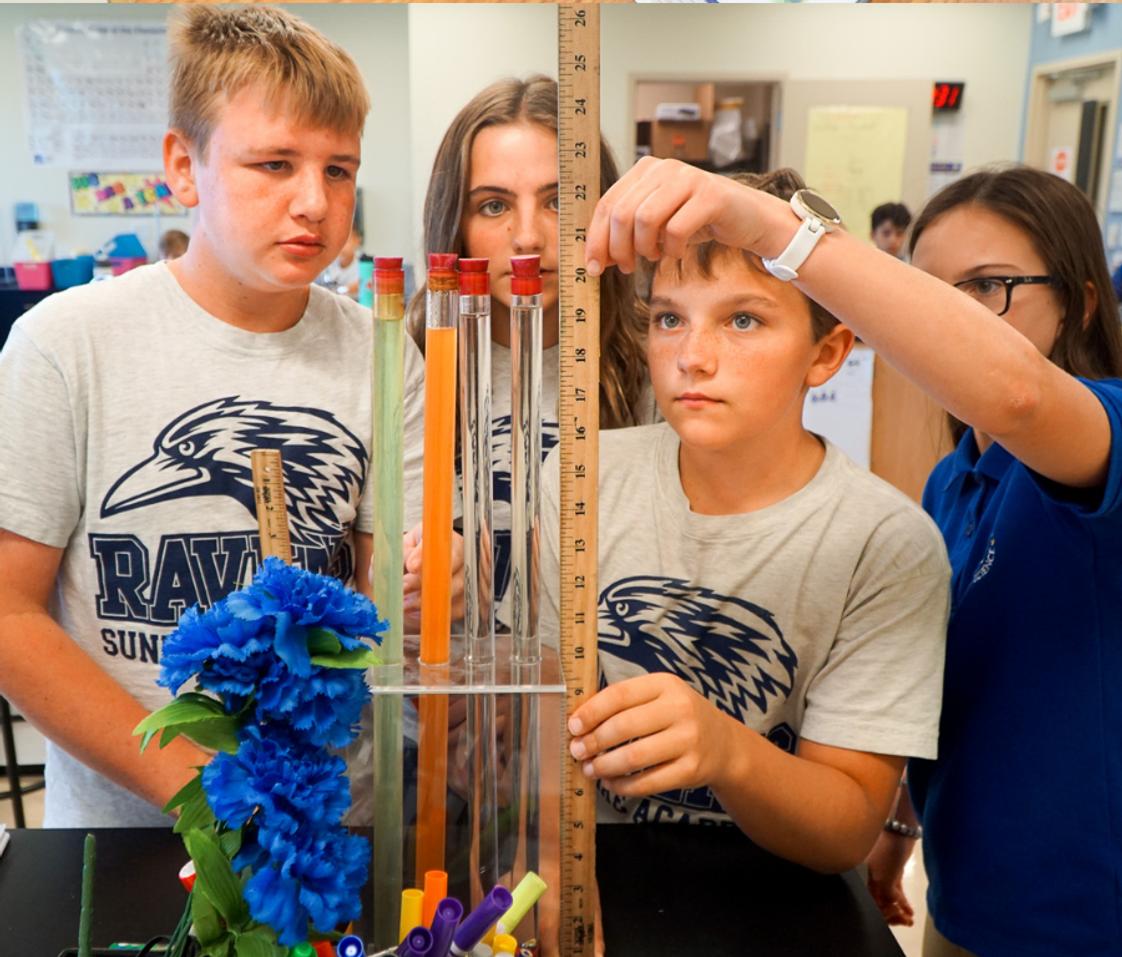
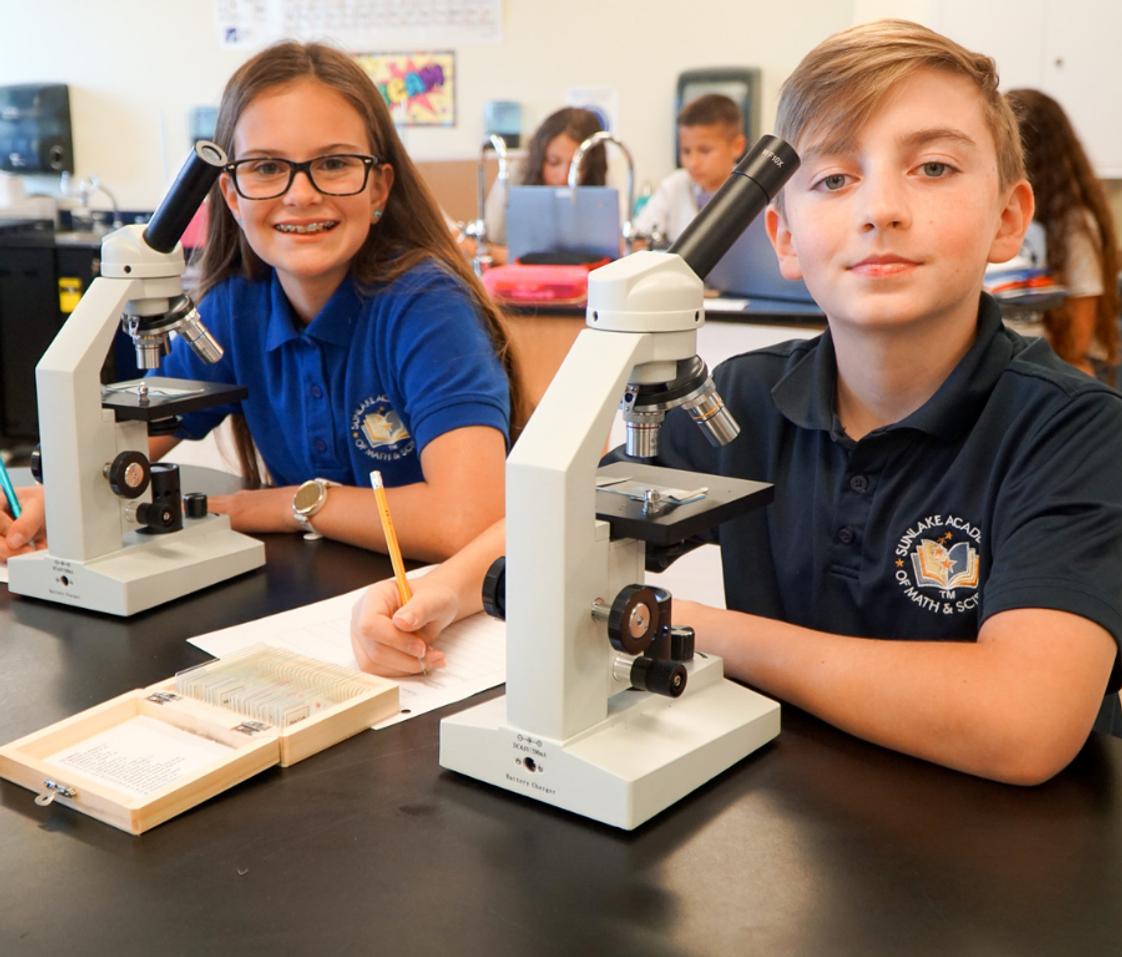
 Certified education. Our Cognia STEM Certified program is designed to ignite students' curiosity, inspire their creativity, and equip them with the skills they need to become future innovators.")

Serving 967 students in grades Kindergarten-8, Sunlake Academy Of Math And Sciences ranks in the top 20% of all schools in Florida for overall test scores (math proficiency is top 20%, and reading proficiency is top 20%).
The percentage of students achieving proficiency in math is 74% (which is higher than the Florida state average of 52%). The percentage of students achieving proficiency in reading/language arts is 76% (which is higher than the Florida state average of 52%).
The student:teacher ratio of 17:1 is equal to the Florida state level of 17:1.
Minority enrollment is 56% of the student body (majority Hispanic), which is lower than the Florida state average of 65% (majority Hispanic).
Quick Stats (2025)
- School Type: Charter School
- Grades: Kindergarten-8
- Enrollment: 967 students
- Student:Teacher Ratio: 17:1
- Minority Enrollment: 56%
- Overall Testing Rank: Top 20% in FL
- Math Proficiency: 74% (Top 20%)
- Reading Proficiency: 76% (Top 10%)
- Science Proficiency: 60-64% (Top 30%)
- Source: National Center for Education Statistics (NCES), FL Dept. of Education
Top Rankings
Sunlake Academy Of Math And Sciences ranks among the top 20% of public schools in Florida for:
Category
Attribute
Overall Rank
Math Proficiency
Reading/Language Arts Proficiency
Diversity
School Overview
Sunlake Academy Of Math And Sciences's student population of 967 students has grown by 10% over five school years.
The teacher population of 58 teachers has grown by 16% over five school years.
School Type
Grades Offered
Grades Kindergarten-8
Total Students
967 students

Gender %

Total Classroom Teachers
58 teachers

Students by Grade

School Calendar
School Rankings
Sunlake Academy Of Math And Sciences ranks within the top 20% of all 3,704 schools in Florida (based off of combined math and reading proficiency testing data).
The diversity score of Sunlake Academy Of Math And Sciences is 0.67, which is less than the diversity score at state average of 0.70. The school's diversity has stayed relatively flat over five school years.
Overall Testing Rank
#412 out of 3704 schools
(Top 20%)
(Top 20%)
Math Test Scores (% Proficient)
74%
52%

Reading/Language Arts Test Scores (% Proficient)
76%
52%

Science Test Scores (% Proficient)
60-64%
52%

Student : Teacher Ratio
17:1
17:1

American Indian
1%
n/a
Asian
11%
3%

Hispanic
35%
37%

Black
5%
21%

White
44%
35%

Hawaiian
n/a
n/a
Two or more races
4%
4%

All Ethnic Groups


Participates in the National School Lunch Program (NSLP)
Yes
Eligible for Free Lunch
22%
47%

Eligible for Reduced Lunch
3%
4%

School Statewide Testing
School District Name
Sports
Total Sports Offered
6 sports
Sports
Basketball, Cheering, Cross Country, Golf, Soccer, Volley Ball
Extracurriculars
Total ExtracurricularsTotal Extra-curric.
25 extracurriculars
ExtracurricularsExtra-curric.
Club or Organization:
Aviation Club, Battle of the Books, BRICKS 4 KIDZ, CHEF IT UP, CHESS CLUB, Coding, Dungeons and Dragons (DND) Club, eSports, Future Cities, Math Competition Team, National Elementary Honor Society (NEHS), National Junior Honor Society (NJHS), Robotics, Rube Goldberg Club, SCUBA DIVING CLUB, Student Council, Sunlake News Network, Yearbook Crew
Arts and Music Programs:
5th Grade Band Club, DANCE CLUB, DRAMA KIDS, Holiday Drama Club, THE COLOR EXPRESS
Recreational Athletic Programs:
KARATE, SOCCER GEMZ
Source: National Center for Education Statistics (NCES), FL Dept. of Education
School Notes
- Sunlake Academy of Math and Scienceis a tuition-free public charter school serving the greater Lutz community for students in Kindergarten to Middle School.Our personalized approach to educating students inspires them to discover their full potential in an environment that celebrates their individual strengths and promotes a community of learners.
Profile last updated: 02/11/2025
Frequently Asked Questions
What is Sunlake Academy Of Math And Sciences's ranking?
Sunlake Academy Of Math And Sciences is ranked #412 out of 3,704 schools, which ranks it among the top 20% of public schools in Florida.
What schools are Sunlake Academy Of Math And Sciences often compared to?
Sunlake Academy Of Math And Sciencesis often viewed alongside schools like Lutz Preparatory School by visitors of our site.
What percent of students have achieved state testing proficiency in math and reading?
74% of students have achieved math proficiency (compared to the 52% FL state average), while 76% of students have achieved reading proficiency (compared to the 52% FL state average).
How many students attend Sunlake Academy Of Math And Sciences?
967 students attend Sunlake Academy Of Math And Sciences.
What is the racial composition of the student body?
44% of Sunlake Academy Of Math And Sciences students are White, 35% of students are Hispanic, 11% of students are Asian, 5% of students are Black, 4% of students are Two or more races, and 1% of students are American Indian.
What is the student:teacher ratio of Sunlake Academy Of Math And Sciences?
Sunlake Academy Of Math And Sciences has a student ration of 17:1, which is equal to the Florida state average of 17:1.
What grades does Sunlake Academy Of Math And Sciences offer ?
Sunlake Academy Of Math And Sciences offers enrollment in grades Kindergarten-8
What school district is Sunlake Academy Of Math And Sciences part of?
Sunlake Academy Of Math And Sciences is part of Hillsborough School District.
School Reviews
Review Sunlake Academy Of Math And Sciences. Reviews should be a few sentences in length. Please include any comments on:
- Quality of academic programs, teachers, and facilities
- Availability of music, art, sports and other extracurricular activities
Recent Articles

What Is A Charter School?
Explore the world of charter schools in this comprehensive guide. Learn about their history, how they operate, and the pros and cons of this educational innovation. Discover key facts about charter schools, including admission policies, demographics, and funding, as well as what to look for when considering a charter school for your child.

10 Reasons Why High School Sports Benefit Students
Discover the 10 compelling reasons why high school sports are beneficial for students. This comprehensive article explores how athletics enhance academic performance, foster personal growth, and develop crucial life skills. From improved fitness and time management to leadership development and community representation, learn why participating in high school sports can be a game-changer for students' overall success and well-being.

February 05, 2025
Understanding the U.S. Department of Education: Structure, Impact, and EvolutionWe explore how the Department of Education shapes American education, from its cabinet-level leadership to its impact on millions of students, written for general audiences seeking clarity on this vital institution.


