Top Rankings
Hillsborough School District ranks among the top 20% of public school district in Florida for:
Category
Attribute
Diversity
Most diverse schools (Top 1%)
Community Size
Largest student body (number of students) (Top 1%)
For the 2025 school year, there are 307 public schools serving 224,133 students in Hillsborough School District. This district's average testing ranking is 5/10, which is in the bottom 50% of public schools in Florida.
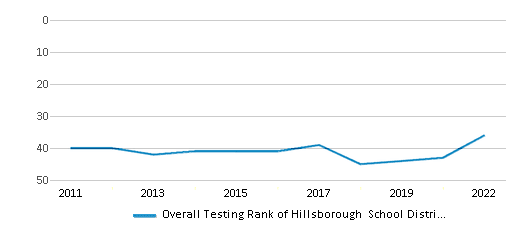
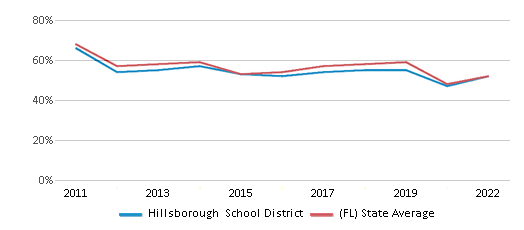
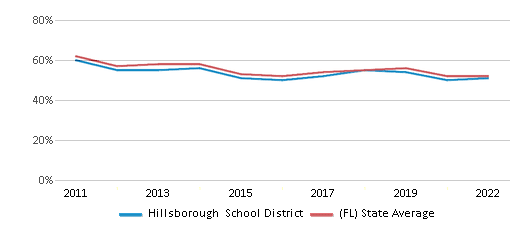
Public Schools in Hillsborough School District have an average math proficiency score of 52% (versus the Florida public school average of 53%), and reading proficiency score of 51% (versus the 52% statewide average).
Minority enrollment is 70% of the student body (majority Hispanic), which is more than the Florida public school average of 66% (majority Hispanic).
Overview
This School District
This State (FL)
# Schools
307 Schools
4,272 Schools
# Students
224,133 Students
2,871,617 Students
# Teachers
12,283 Teachers
155,327 Teachers
Student : Teacher Ratio
18:1
18:1
District Rank
Hillsborough School District, which is ranked within the bottom 50% of all 73 school districts in Florida (based off of combined math and reading proficiency testing data) for the 2021-2022 school year.
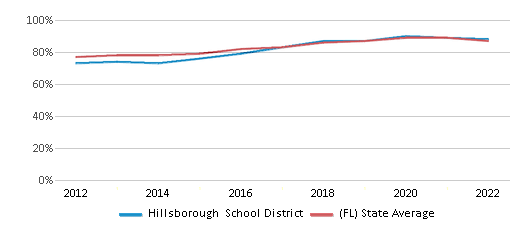
The school district's graduation rate of 88% has increased from 83% over five school years.
Overall District Rank
#36 out of 73 school districts
(Top 50%)
(Top 50%)
Math Test Scores (% Proficient)
52%
52%
Reading/Language Arts Test Scores (% Proficient)
51%
52%
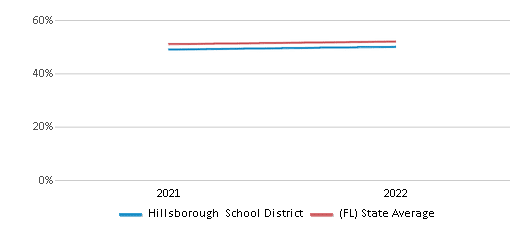
Science Test Scores (% Proficient)
50%
52%
Graduation Rate
88%
87%
Students by Ethnicity:
Diversity Score
0.72
0.70
# American Indian Students
412 Students
7,127 Students
% American Indian Students
n/a
n/a
# Asian Students
10,054 Students
82,684 Students
% Asian Students
4%
3%
# Hispanic Students
88,703 Students
1,067,518 Students
% Hispanic Students
40%
37%
# Black Students
46,321 Students
599,852 Students
% Black Students
21%
21%
# White Students
66,478 Students
988,678 Students
% White Students
30%
35%
# Hawaiian Students
380 Students
4,961 Students
% Hawaiian Students
n/a
n/a
# Two or more races Students
11,785 Students
120,797 Students
% of Two or more races Students
5%
4%
Students by Grade:
# Students in PK Grade:
4,850
65,492
# Students in K Grade:
15,528
195,805
# Students in 1st Grade:
16,296
204,872
# Students in 2nd Grade:
16,832
211,537
# Students in 3rd Grade:
16,975
217,908
# Students in 4th Grade:
17,143
214,300
# Students in 5th Grade:
16,858
205,644
# Students in 6th Grade:
16,402
210,929
# Students in 7th Grade:
17,144
223,117
# Students in 8th Grade:
17,262
218,377
# Students in 9th Grade:
17,906
233,011
# Students in 10th Grade:
18,238
236,046
# Students in 11th Grade:
17,133
221,011
# Students in 12th Grade:
15,566
213,568
# Ungraded Students:
-
-
District Revenue and Spending
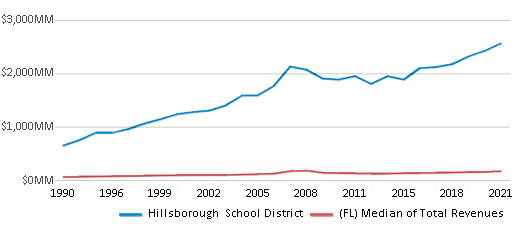
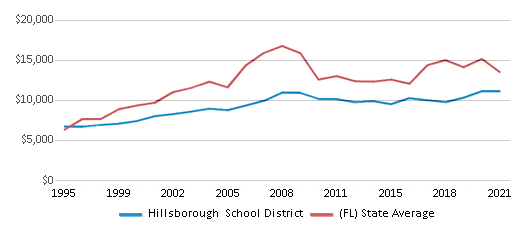
The revenue/student of $11,439 in this school district is less than the state median of $11,962. The school district revenue/student has stayed relatively flat over four school years.
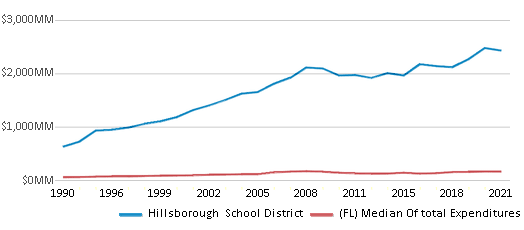
The school district's spending/student of $10,846 is less than the state median of $11,615. The school district spending/student has stayed relatively flat over four school years.
Total Revenue
$2,564 MM
$34,349 MM
Spending
$2,431 MM
$33,354 MM
Revenue / Student
$11,439
$11,962
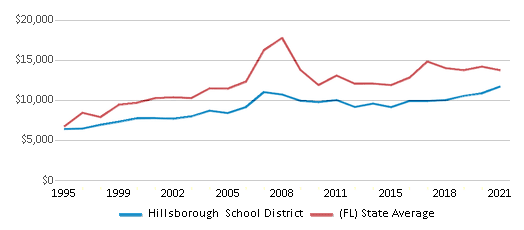
Spending / Student
$10,846
$11,615
Best Hillsborough School District Public Schools (2025)
School
(Math and Reading Proficiency)
(Math and Reading Proficiency)
Location
Grades
Students
Rank: #11.
Terrace Community Middle School
Charter School
(Math: 93% | Reading: 90%)
Rank:
Rank:
10/
Top 1%10
10735 Raulerson Ranch Road
Tampa, FL 33367
(813) 450-3518
Tampa, FL 33367
(813) 450-3518
Grades: 6-8
| 658 students
Rank: #22.
Mckitrick Elementary School
(Math: 91% | Reading: 88%)
Rank:
Rank:
10/
Top 1%10
5503 W Lutz Lake Fern Rd
Lutz, FL 33558
(813) 558-5427
Lutz, FL 33558
(813) 558-5427
Grades: PK-5
| 967 students
Rank: #33.
Bryant Elementary School
(Math: 94% | Reading: 86%)
Rank:
Rank:
10/
Top 5%10
13910 Nine Eagles Dr
Tampa, FL 33626
(813) 356-1645
Tampa, FL 33626
(813) 356-1645
Grades: PK-5
| 898 students
Rank: #44.
Roosevelt Elementary School
(Math: 92% | Reading: 85%)
Rank:
Rank:
10/
Top 5%10
3205 S Ferdinand Ave
Tampa, FL 33629
(813) 272-3090
Tampa, FL 33629
(813) 272-3090
Grades: PK-5
| 691 students
Rank: #55.
Bevis Elementary School
(Math: 91% | Reading: 86%)
Rank:
Rank:
10/
Top 5%10
5720 Osprey Ridge Dr
Lithia, FL 33547
(813) 740-4000
Lithia, FL 33547
(813) 740-4000
Grades: PK-5
| 866 students
Rank: #66.
Horizon Charter School Of Tampa
Charter School
(Math: 85-89% | Reading: 85-89%)
Rank:
Rank:
10/
Top 5%10
7235 W Hillsborough Ave
Tampa, FL 33634
(813) 887-3800
Tampa, FL 33634
(813) 887-3800
Grades: K-8
| 312 students
Rank: #77.
Lutz Preparatory School
Charter School
(Math: 91% | Reading: 84%)
Rank:
Rank:
10/
Top 5%10
17951 N Us Highway 41
Lutz, FL 33549
(813) 428-7100
Lutz, FL 33549
(813) 428-7100
Grades: K-8
| 783 students
Rank: #88.
Mabry Elementary School
(Math: 89% | Reading: 84%)
Rank:
Rank:
10/
Top 5%10
4201 W Estrella St
Tampa, FL 33629
(813) 872-5364
Tampa, FL 33629
(813) 872-5364
Grades: PK-5
| 840 students
Rank: #99.
Grady Elementary School
(Math: 88% | Reading: 84%)
Rank:
Rank:
10/
Top 5%10
3910 W Morrison Ave
Tampa, FL 33629
(813) 872-5325
Tampa, FL 33629
(813) 872-5325
Grades: PK-5
| 557 students
Rank: #1010.
Fishhawk Creek Elementary School
(Math: 89% | Reading: 83%)
Rank:
Rank:
10/
Top 5%10
16815 Dorman Rd
Lithia, FL 33547
(813) 651-2150
Lithia, FL 33547
(813) 651-2150
Grades: PK-5
| 1,017 students
Rank: #1111.
Mitchell Elementary School
(Math: 85% | Reading: 84%)
Rank:
Rank:
10/
Top 5%10
205 S Bungalow Park Ave
Tampa, FL 33609
(813) 872-5216
Tampa, FL 33609
(813) 872-5216
Grades: PK-5
| 695 students
Rank: #1212.
Walker Middle Magnet School
Magnet School
(Math: 85% | Reading: 83%)
Rank:
Rank:
10/
Top 5%10
8282 N Mobley Rd
Odessa, FL 33556
(813) 631-4726
Odessa, FL 33556
(813) 631-4726
Grades: 6-8
| 1,007 students
Rank: #1313.
Stowers Elementary School
(Math: 87% | Reading: 81%)
Rank:
Rank:
10/
Top 5%10
13915 Barrington Stowers Dr
Lithia, FL 33547
(813) 657-7431
Lithia, FL 33547
(813) 657-7431
Grades: PK-5
| 930 students
Rank: #1414.
Gorrie Elementary School
(Math: 86% | Reading: 80%)
Rank:
Rank:
10/
Top 5%10
705 W Deleon St
Tampa, FL 33606
(813) 276-5673
Tampa, FL 33606
(813) 276-5673
Grades: PK-5
| 509 students
Rank: #1515.
Pride Elementary School
(Math: 83% | Reading: 80%)
Rank:
Rank:
10/
Top 10%10
10310 Lions Den Dr
Tampa, FL 33647
(813) 558-5400
Tampa, FL 33647
(813) 558-5400
Grades: PK-5
| 995 students
Rank: #1616.
Clark Elementary School
(Math: 88% | Reading: 76%)
Rank:
Rank:
10/
Top 10%10
19002 Wood Sage Dr
Tampa, FL 33647
(813) 631-4333
Tampa, FL 33647
(813) 631-4333
Grades: PK-5
| 888 students
Rank: #1717.
Chiles Elementary School
(Math: 84% | Reading: 78%)
Rank:
Rank:
10/
Top 10%10
16541 Tampa Palms Blvd W
Tampa, FL 33647
(813) 558-5422
Tampa, FL 33647
(813) 558-5422
Grades: PK-5
| 822 students
Rank: #1818.
Schwarzkopf Elementary School
(Math: 85% | Reading: 76%)
Rank:
Rank:
10/
Top 10%10
18333 Calusa Trace Blvd
Lutz, FL 33558
(813) 975-6945
Lutz, FL 33558
(813) 975-6945
Grades: PK-5
| 571 students
Rank: #1919.
Williams Middle Magnet School
Magnet School
(Math: 80% | Reading: 80%)
Rank:
Rank:
10/
Top 10%10
5020 N 47th St
Tampa, FL 33610
(813) 744-8600
Tampa, FL 33610
(813) 744-8600
Grades: 6-8
| 847 students
Rank: #2020.
Macfarlane Park Elementary Magnet School
Magnet School
(Math: 80-84% | Reading: 75-79%)
Rank:
Rank:
10/
Top 10%10
1721 N Macdill Ave
Tampa, FL 33607
(813) 356-1760
Tampa, FL 33607
(813) 356-1760
Grades: K-5
| 381 students
Rank: #2121.
Coleman Middle School
(Math: 84% | Reading: 75%)
Rank:
Rank:
10/
Top 10%10
1724 S Manhattan Ave
Tampa, FL 33629
(813) 872-5335
Tampa, FL 33629
(813) 872-5335
Grades: 6-8
| 951 students
Rank: #2222.
Lithia Springs Elementary School
(Math: 80% | Reading: 77%)
Rank:
Rank:
10/
Top 10%10
4332 Lynx Paw Trl
Valrico, FL 33596
(813) 744-8016
Valrico, FL 33596
(813) 744-8016
Grades: PK-5
| 578 students
Rank: #23 - 2423. - 24.
Martinez Middle School
(Math: 82% | Reading: 75%)
Rank:
Rank:
10/
Top 10%10
5601 W Lutz Lake Fern Rd
Lutz, FL 33558
(813) 558-1190
Lutz, FL 33558
(813) 558-1190
Grades: 6-8
| 1,127 students
Rank: #23 - 2423. - 24.
Northwest Elementary School
(Math: 82% | Reading: 75%)
Rank:
Rank:
10/
Top 10%10
16438 Hutchison Rd
Tampa, FL 33625
(813) 975-7315
Tampa, FL 33625
(813) 975-7315
Grades: PK-5
| 693 students
Rank: #2525.
Hunter's Green Elementary School
(Math: 81% | Reading: 76%)
Rank:
Rank:
10/
Top 10%10
9202 Highland Oak Dr
Tampa, FL 33647
(813) 973-7394
Tampa, FL 33647
(813) 973-7394
Grades: PK-5
| 810 students
Rank: #26 - 2726. - 27.
Ballast Point Elementary School
(Math: 79% | Reading: 77%)
Rank:
Rank:
10/
Top 10%10
2802 W Ballast Point Blvd
Tampa, FL 33611
(813) 272-3070
Tampa, FL 33611
(813) 272-3070
Grades: PK-5
| 473 students
Rank: #26 - 2726. - 27.
Hammond Elementary School
(Math: 79% | Reading: 77%)
Rank:
Rank:
10/
Top 10%10
8008 N Mobley Rd
Odessa, FL 33556
(813) 792-5120
Odessa, FL 33556
(813) 792-5120
Grades: PK-5
| 708 students
Rank: #2828.
Randall Middle School
(Math: 81% | Reading: 75%)
Rank:
Rank:
10/
Top 10%10
16510 Fishhawk Blvd
Lithia, FL 33547
(813) 740-3900
Lithia, FL 33547
(813) 740-3900
Grades: 6-8
| 1,361 students
Rank: #2929.
Wilson Middle School
(Math: 80% | Reading: 76%)
Rank:
Rank:
10/
Top 10%10
1005 W Swann Ave
Tampa, FL 33606
(813) 276-5682
Tampa, FL 33606
(813) 276-5682
Grades: 6-8
| 619 students
Rank: #3030.
Westchase Elementary School
(Math: 80% | Reading: 75%)
Rank:
Rank:
10/
Top 10%10
9517 W Linebaugh Ave
Tampa, FL 33626
(813) 631-4600
Tampa, FL 33626
(813) 631-4600
Grades: PK-5
| 894 students
Rank: #3131.
Deer Park Elementary School
(Math: 79% | Reading: 75%)
Rank:
Rank:
10/
Top 10%10
11605 Citrus Park Dr
Tampa, FL 33626
(813) 854-6031
Tampa, FL 33626
(813) 854-6031
Grades: PK-5
| 993 students
Rank: #3232.
Roland Park K-8 Magnet School
Magnet School
(Math: 77% | Reading: 75%)
Rank:
Rank:
10/
Top 10%10
1510 N Manhattan Ave
Tampa, FL 33607
(813) 872-5212
Tampa, FL 33607
(813) 872-5212
Grades: K-8
| 880 students
Rank: #33 - 3433. - 34.
Tinker K-8 School
(Math: 80% | Reading: 71%)
Rank:
Rank:
9/
Top 20%10
8207 Tinker St Macdill Afb
Tampa, FL 33621
(813) 840-2043
Tampa, FL 33621
(813) 840-2043
Grades: PK-8
| 588 students
Rank: #33 - 3433. - 34.
Winthrop Charter School
Charter School
(Math: 78% | Reading: 72%)
Rank:
Rank:
9/
Top 20%10
6204 Scholars Hill Ln
Riverview, FL 33578
(813) 235-4811
Riverview, FL 33578
(813) 235-4811
Grades: K-8
| 1,344 students
Rank: #3535.
Sunlake Academy Of Math And Sciences
Charter School
(Math: 74% | Reading: 76%)
Rank:
Rank:
9/
Top 20%10
18681 N Dale Mabry Hwy
Lutz, FL 33548
(813) 619-5099
Lutz, FL 33548
(813) 619-5099
Grades: K-8
| 967 students
Show 100 more public schools in Hillsborough School District (out of 307 total schools)
Loading...
Frequently Asked Questions
How many schools belong to Hillsborough School District?
Hillsborough School District manages 307 public schools serving 224,133 students.
What is the rank of Hillsborough School District?
Hillsborough School District is ranked #38 out of 73 school districts in Florida (bottom 50%) based off of combined math and reading proficiency testing data for the 2021-2022 school year. This district ranks in the top 20% of Florida school districts for: Most diverse schools (Top 1%) and Largest student body (number of students) (Top 1%)
What is the racial composition of students in Hillsborough School District?
40% of Hillsborough School District students are Hispanic, 30% of students are White, 21% of students are Black, 5% of students are Two or more races, and 4% of students are Asian.
What is the student/teacher ratio of Hillsborough School District?
Hillsborough School District has a student/teacher ratio of 18:1, which is equal to the Florida state average of 18:1.
What is Hillsborough School District's spending/student ratio?
The school district's spending/student of $10,846 is less than the state median of $11,615. The school district spending/student has stayed relatively flat over four school years.
Recent Articles

Year-Round Or Traditional Schedule?
Which is more appropriate for your child? A year-round attendance schedule or traditional schedule? We look at the pros and cons.

Why You Should Encourage Your Child to Join a Sports Team
Participating in team sports has a great many benefits for children, there is no doubt. In this article you will learn what those benefits are.

White Students are Now the Minority in U.S. Public Schools
Increasing birth rates among immigrant families from Asia and Central and South America, combined with lower birth rates among white families, means that for the first time in history, public school students in the United States are majority-minority. This shift in demographics poses difficulties for schools as they work to accommodate children of varying language abilities and socio-economic backgrounds.


