Top Rankings
Hillsborough School District ranks among the top 20% of public school district in Florida for:
Category
Attribute
Diversity
Most diverse schools (Top 1%)
Community Size
Largest student body (number of students) (Top 1%)
For the 2025 school year, there are 125 public middle schools serving 79,980 students in Hillsborough School District. This district's average middle testing ranking is 5/10, which is in the bottom 50% of public middle schools in Florida.
Public Middle Schools in Hillsborough School District have an average math proficiency score of 50% (versus the Florida public middle school average of 53%), and reading proficiency score of 50% (versus the 52% statewide average).
Minority enrollment is 70% of the student body (majority Hispanic), which is more than the Florida public middle school average of 66% (majority Hispanic).
Overview
This School District
This State (FL)
# Schools
307 Schools
1,745 Schools
# Students
224,133 Students
1,042,011 Students
# Teachers
12,283 Teachers
54,708 Teachers
Student : Teacher Ratio
18:1
18:1
District Rank
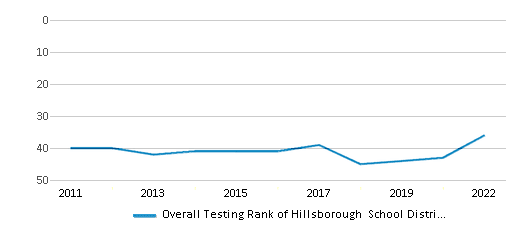
Hillsborough School District, which is ranked within the bottom 50% of all 73 school districts in Florida (based off of combined math and reading proficiency testing data) for the 2021-2022 school year.
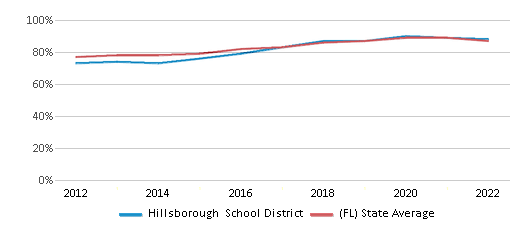
The school district's graduation rate of 88% has increased from 83% over five school years.
Overall District Rank
#36 out of 73 school districts
(Top 50%)
(Top 50%)
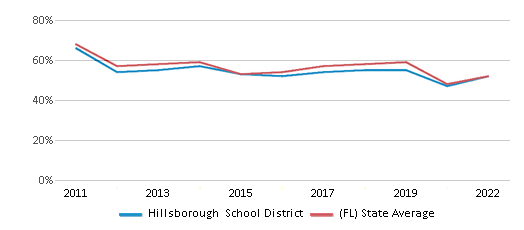
Math Test Scores (% Proficient)
52%
52%
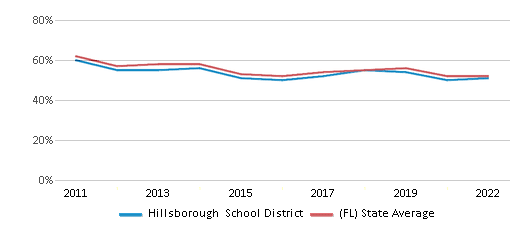
Reading/Language Arts Test Scores (% Proficient)
51%
52%
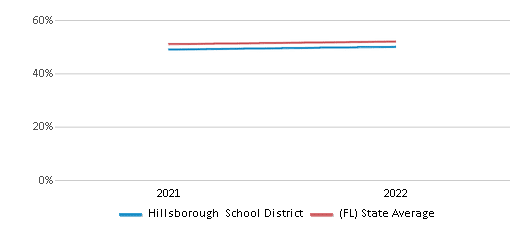
Science Test Scores (% Proficient)
50%
52%
Graduation Rate
88%
87%
Students by Ethnicity:
Diversity Score
0.72
0.70
# American Indian Students
412 Students
2,890 Students
% American Indian Students
n/a
n/a
# Asian Students
10,054 Students
29,883 Students
% Asian Students
4%
3%
# Hispanic Students
88,703 Students
401,138 Students
% Hispanic Students
40%
38%
# Black Students
46,321 Students
215,725 Students
% Black Students
21%
21%
# White Students
66,478 Students
349,085 Students
% White Students
30%
34%
# Hawaiian Students
380 Students
1,862 Students
% Hawaiian Students
n/a
n/a
# Two or more races Students
11,785 Students
41,428 Students
% of Two or more races Students
5%
4%
Students by Grade:
# Students in PK Grade:
4,850
6,785
# Students in K Grade:
15,528
37,786
# Students in 1st Grade:
16,296
39,534
# Students in 2nd Grade:
16,832
40,863
# Students in 3rd Grade:
16,975
42,129
# Students in 4th Grade:
17,143
42,303
# Students in 5th Grade:
16,858
42,249
# Students in 6th Grade:
16,402
201,326
# Students in 7th Grade:
17,144
223,117
# Students in 8th Grade:
17,262
218,377
# Students in 9th Grade:
17,906
37,509
# Students in 10th Grade:
18,238
38,273
# Students in 11th Grade:
17,133
34,944
# Students in 12th Grade:
15,566
36,816
# Ungraded Students:
-
-
District Revenue and Spending
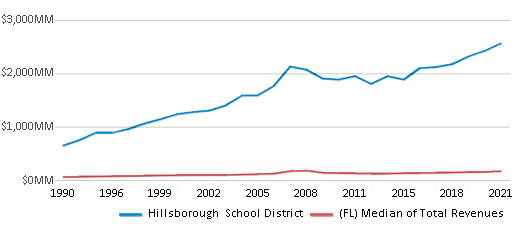
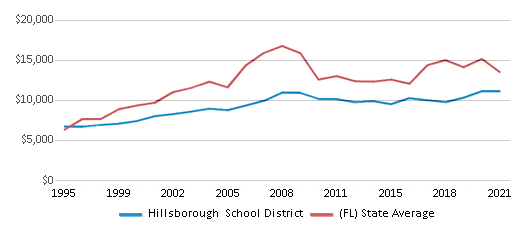
The revenue/student of $11,439 in this school district is less than the state median of $11,962. The school district revenue/student has stayed relatively flat over four school years.
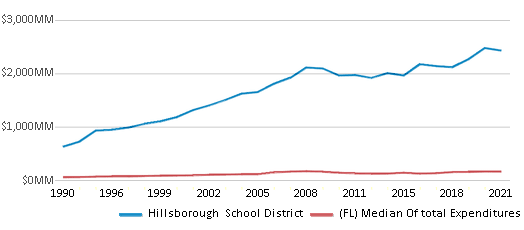
The school district's spending/student of $10,846 is less than the state median of $11,615. The school district spending/student has stayed relatively flat over four school years.
Total Revenue
$2,564 MM
$34,349 MM
Spending
$2,431 MM
$33,354 MM
Revenue / Student
$11,439
$11,962
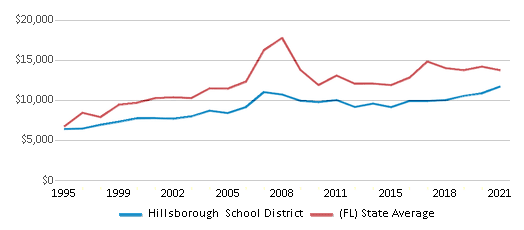
Spending / Student
$10,846
$11,615
Best Hillsborough School District Public Middle Schools (2025)
School
(Math and Reading Proficiency)
(Math and Reading Proficiency)
Location
Grades
Students
Rank: #11.
Terrace Community Middle School
Charter School
(Math: 93% | Reading: 90%)
Rank:
Rank:
10/
Top 1%10
10735 Raulerson Ranch Road
Tampa, FL 33367
(813) 450-3518
Tampa, FL 33367
(813) 450-3518
Grades: 6-8
| 658 students
Rank: #22.
Horizon Charter School Of Tampa
Charter School
(Math: 85-89% | Reading: 85-89%)
Rank:
Rank:
10/
Top 5%10
7235 W Hillsborough Ave
Tampa, FL 33634
(813) 887-3800
Tampa, FL 33634
(813) 887-3800
Grades: K-8
| 312 students
Rank: #33.
Lutz Preparatory School
Charter School
(Math: 91% | Reading: 84%)
Rank:
Rank:
10/
Top 5%10
17951 N Us Highway 41
Lutz, FL 33549
(813) 428-7100
Lutz, FL 33549
(813) 428-7100
Grades: K-8
| 783 students
Rank: #44.
Walker Middle Magnet School
Magnet School
(Math: 85% | Reading: 83%)
Rank:
Rank:
10/
Top 5%10
8282 N Mobley Rd
Odessa, FL 33556
(813) 631-4726
Odessa, FL 33556
(813) 631-4726
Grades: 6-8
| 1,007 students
Rank: #55.
Williams Middle Magnet School
Magnet School
(Math: 80% | Reading: 80%)
Rank:
Rank:
10/
Top 10%10
5020 N 47th St
Tampa, FL 33610
(813) 744-8600
Tampa, FL 33610
(813) 744-8600
Grades: 6-8
| 847 students
Rank: #66.
Coleman Middle School
(Math: 84% | Reading: 75%)
Rank:
Rank:
10/
Top 10%10
1724 S Manhattan Ave
Tampa, FL 33629
(813) 872-5335
Tampa, FL 33629
(813) 872-5335
Grades: 6-8
| 951 students
Rank: #77.
Martinez Middle School
(Math: 82% | Reading: 75%)
Rank:
Rank:
10/
Top 10%10
5601 W Lutz Lake Fern Rd
Lutz, FL 33558
(813) 558-1190
Lutz, FL 33558
(813) 558-1190
Grades: 6-8
| 1,127 students
Rank: #88.
Randall Middle School
(Math: 81% | Reading: 75%)
Rank:
Rank:
10/
Top 10%10
16510 Fishhawk Blvd
Lithia, FL 33547
(813) 740-3900
Lithia, FL 33547
(813) 740-3900
Grades: 6-8
| 1,361 students
Rank: #99.
Wilson Middle School
(Math: 80% | Reading: 76%)
Rank:
Rank:
10/
Top 10%10
1005 W Swann Ave
Tampa, FL 33606
(813) 276-5682
Tampa, FL 33606
(813) 276-5682
Grades: 6-8
| 619 students
Rank: #1010.
Roland Park K-8 Magnet School
Magnet School
(Math: 77% | Reading: 75%)
Rank:
Rank:
10/
Top 10%10
1510 N Manhattan Ave
Tampa, FL 33607
(813) 872-5212
Tampa, FL 33607
(813) 872-5212
Grades: K-8
| 880 students
Rank: #11 - 1211. - 12.
Tinker K-8 School
(Math: 80% | Reading: 71%)
Rank:
Rank:
9/
Top 20%10
8207 Tinker St Macdill Afb
Tampa, FL 33621
(813) 840-2043
Tampa, FL 33621
(813) 840-2043
Grades: PK-8
| 588 students
Rank: #11 - 1211. - 12.
Winthrop Charter School
Charter School
(Math: 78% | Reading: 72%)
Rank:
Rank:
9/
Top 20%10
6204 Scholars Hill Ln
Riverview, FL 33578
(813) 235-4811
Riverview, FL 33578
(813) 235-4811
Grades: K-8
| 1,344 students
Rank: #1313.
Sunlake Academy Of Math And Sciences
Charter School
(Math: 74% | Reading: 76%)
Rank:
Rank:
9/
Top 20%10
18681 N Dale Mabry Hwy
Lutz, FL 33548
(813) 619-5099
Lutz, FL 33548
(813) 619-5099
Grades: K-8
| 967 students
Rank: #1414.
Farnell Middle School
(Math: 75% | Reading: 74%)
Rank:
Rank:
9/
Top 20%10
13912 Nine Eagles Dr
Tampa, FL 33626
(813) 356-1640
Tampa, FL 33626
(813) 356-1640
Grades: 6-8
| 1,200 students
Rank: #1515.
Bell Creek Academy
Charter School
(Math: 65-69% | Reading: 80%)
Rank:
Rank:
9/
Top 20%10
13221 Boyette Rd
Riverview, FL 33569
(813) 793-6075
Riverview, FL 33569
(813) 793-6075
Grades: 6-12
| 1,131 students
Rank: #1616.
Maniscalco K-8 School
(Math: 74% | Reading: 67%)
Rank:
Rank:
9/
Top 20%10
939 Debuel Rd
Lutz, FL 33549
(813) 949-0337
Lutz, FL 33549
(813) 949-0337
Grades: PK-8
| 668 students
Rank: #1717.
Plato Academy Tampa Charter School
Charter School
(Math: 65-69% | Reading: 70-74%)
Rank:
Rank:
9/
Top 20%10
7705 Gunn Highway
Tampa, FL 33625
(813) 222-8687
Tampa, FL 33625
(813) 222-8687
Grades: K-8
| 391 students
Rank: #1818.
Carrollwood K-8 School
(Math: 68% | Reading: 67%)
Rank:
Rank:
9/
Top 20%10
3516 Mcfarland Rd
Tampa, FL 33618
(813) 975-7640
Tampa, FL 33618
(813) 975-7640
Grades: PK-8
| 715 students
Rank: #1919.
Lutz K-8 School
(Math: 71% | Reading: 62%)
Rank:
Rank:
8/
Top 30%10
202 5th Ave Se
Lutz, FL 33549
(813) 949-1452
Lutz, FL 33549
(813) 949-1452
Grades: PK-8
| 770 students
Rank: #2020.
Rampello K-8 Magnet School
Magnet School
(Math: 69% | Reading: 62%)
Rank:
Rank:
8/
Top 30%10
802 E Washington St
Tampa, FL 33602
(813) 233-2333
Tampa, FL 33602
(813) 233-2333
Grades: K-8
| 806 students
Rank: #2121.
Learning Gate Community School
Charter School
(Math: 63% | Reading: 67%)
Rank:
Rank:
8/
Top 30%10
16215 Hanna Rd
Lutz, FL 33549
(813) 948-4190
Lutz, FL 33549
(813) 948-4190
Grades: K-8
| 771 students
Rank: #2222.
Benito Middle School
(Math: 64% | Reading: 61%)
Rank:
Rank:
8/
Top 30%10
10101 Cross Creek Blvd
Tampa, FL 33647
(813) 631-4694
Tampa, FL 33647
(813) 631-4694
Grades: 6-8
| 1,016 students
Rank: #2323.
Trinity School For Children
Charter School
(Math: 63% | Reading: 61%)
Rank:
Rank:
8/
Top 30%10
2402 W Osborne Ave
Tampa, FL 33603
(813) 874-2402
Tampa, FL 33603
(813) 874-2402
Grades: K-8
| 903 students
Rank: #2424.
Hillsborough Virtual School
(Math: 52% | Reading: 72%)
Rank:
Rank:
8/
Top 30%10
2704 N Highland Ave
Tampa, FL 33602
(813) 272-4362
Tampa, FL 33602
(813) 272-4362
Grades: K-12
| 613 students
Rank: #2525.
Collins Pk-8 School
(Math: 62% | Reading: 60%)
Rank:
Rank:
8/
Top 30%10
12424 Summerfield Blvd
Riverview, FL 33579
(813) 672-5400
Riverview, FL 33579
(813) 672-5400
Grades: PK-8
| 1,534 students
Rank: #2626.
Barrington Middle School
(Math: 64% | Reading: 57%)
Rank:
Rank:
8/
Top 30%10
5925 Village Center Dr
Lithia, FL 33547
(813) 657-7266
Lithia, FL 33547
(813) 657-7266
Grades: 6-8
| 1,279 students
Rank: #2727.
Hillsborough Academy Of Math And Science
Charter School
(Math: 56% | Reading: 62%)
Rank:
Rank:
7/
Top 50%10
9659 W Waters Ave
Tampa, FL 33635
(813) 793-6085
Tampa, FL 33635
(813) 793-6085
Grades: K-8
| 835 students
Rank: #2828.
Burns Middle School
(Math: 59% | Reading: 58%)
Rank:
Rank:
7/
Top 50%10
615 Brooker Rd
Brandon, FL 33511
(813) 744-8383
Brandon, FL 33511
(813) 744-8383
Grades: 6-8
| 1,192 students
Rank: #2929.
Mulrennan Middle School
(Math: 59% | Reading: 57%)
Rank:
Rank:
7/
Top 50%10
4215 Durant Rd
Valrico, FL 33596
(813) 651-2100
Valrico, FL 33596
(813) 651-2100
Grades: 6-8
| 1,166 students
Rank: #3030.
Waterset Charter School
Charter School
(Math: 54% | Reading: 58%)
Rank:
Rank:
7/
Top 50%10
6540 Knowledge Ln
Apollo Beach, FL 33572
(813) 602-0622
Apollo Beach, FL 33572
(813) 602-0622
Grades: K-8
| 1,164 students
Rank: #3131.
Riverview Academy Of Math And Science
Charter School
(Math: 50% | Reading: 63%)
Rank:
Rank:
7/
Top 50%10
9906 Symmes Rd
Viera, FL 33578
(813) 412-6111
Viera, FL 33578
(813) 412-6111
Grades: K-12
| 1,121 students
Rank: #3232.
Liberty Middle School
(Math: 58% | Reading: 52%)
Rank:
Rank:
7/
Top 50%10
17400 Commerce Park Blvd
Tampa, FL 33647
(813) 558-1180
Tampa, FL 33647
(813) 558-1180
Grades: 6-8
| 948 students
Rank: #3333.
Turner-bartels K-8 School
(Math: 54% | Reading: 56%)
Rank:
Rank:
7/
Top 50%10
9190 Imperial Oak Blvd
Tampa, FL 33647
(813) 907-9066
Tampa, FL 33647
(813) 907-9066
Grades: PK-8
| 1,398 students
Rank: #3434.
Ferrell Middle Magnet School
Magnet School
(Math: 60% | Reading: 51%)
Rank:
Rank:
7/
Top 50%10
4302 N 24th St
Tampa, FL 33610
(813) 276-5608
Tampa, FL 33610
(813) 276-5608
Grades: 6-8
| 421 students
Rank: #3535.
Progress Village Middle Magnet
Magnet School
(Math: 51% | Reading: 59%)
Rank:
Rank:
7/
Top 50%10
8113 Zinnia Dr
Tampa, FL 33619
(813) 671-5110
Tampa, FL 33619
(813) 671-5110
Grades: 6-8
| 744 students
Show 90 more public schools in Hillsborough School District (out of 125 total schools)
Loading...
Recent Articles

What Is A Charter School?
Explore the world of charter schools in this comprehensive guide. Learn about their history, how they operate, and the pros and cons of this educational innovation. Discover key facts about charter schools, including admission policies, demographics, and funding, as well as what to look for when considering a charter school for your child.

10 Reasons Why High School Sports Benefit Students
Discover the 10 compelling reasons why high school sports are beneficial for students. This comprehensive article explores how athletics enhance academic performance, foster personal growth, and develop crucial life skills. From improved fitness and time management to leadership development and community representation, learn why participating in high school sports can be a game-changer for students' overall success and well-being.

February 05, 2025
Understanding the U.S. Department of Education: Structure, Impact, and EvolutionWe explore how the Department of Education shapes American education, from its cabinet-level leadership to its impact on millions of students, written for general audiences seeking clarity on this vital institution.


