Top Rankings
Hamilton County School District ranks among the top 20% of public school district in Tennessee for:
Category
Attribute
Diversity
Most diverse schools (Top 1%)
Community Size
Largest student body (number of students) (Top 1%)
For the 2025 school year, there are 32 public preschools serving 18,108 students in Hamilton County School District. This district's average pre testing ranking is 7/10, which is in the top 50% of public pre schools in Tennessee.
Public Preschools in Hamilton County School District have an average math proficiency score of 40% (versus the Tennessee public pre school average of 37%), and reading proficiency score of 38% (versus the 37% statewide average).
Minority enrollment is 56% of the student body (majority Black), which is more than the Tennessee public preschool average of 42% (majority Black).
Overview
This School District
This State (TN)
# Schools
82 Schools
890 Schools
# Students
45,790 Students
417,431 Students
# Teachers
3,065 Teachers
28,312 Teachers
Student : Teacher Ratio
15:1
15:1
District Rank
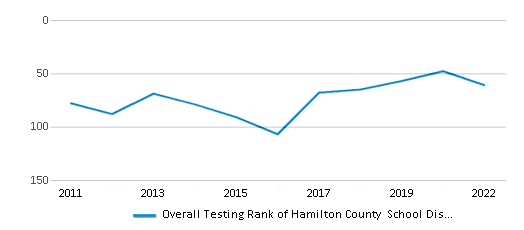
Hamilton County School District, which is ranked within the top 50% of all 147 school districts in Tennessee (based off of combined math and reading proficiency testing data) for the 2021-2022 school year.
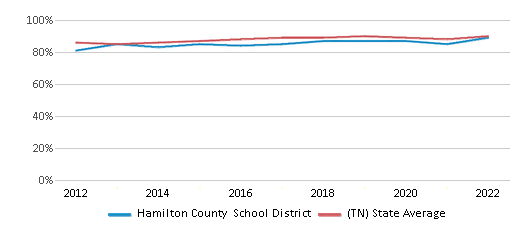
The school district's graduation rate of 89% has increased from 85% over five school years.
Overall District Rank
#61 out of 147 school districts
(Top 50%)
(Top 50%)
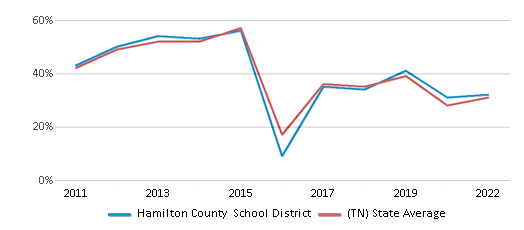
Math Test Scores (% Proficient)
32%
31%
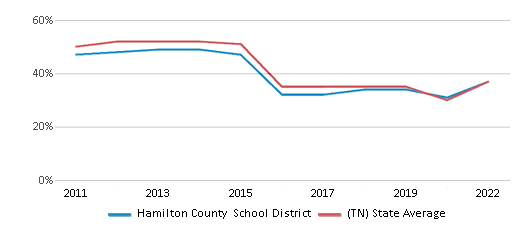
Reading/Language Arts Test Scores (% Proficient)
37%
37%
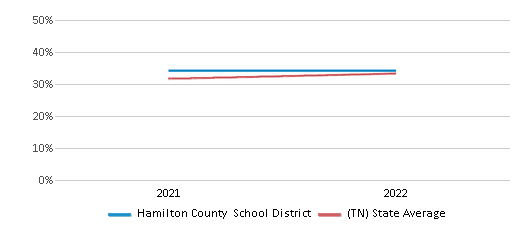
Science Test Scores (% Proficient)
41%
40%
Graduation Rate
89%
90%
Students by Ethnicity:
Diversity Score
0.69
0.61
# American Indian Students
30 Students
758 Students
% American Indian Students
n/a
n/a
# Asian Students
830 Students
8,008 Students
% Asian Students
2%
2%
# Hispanic Students
9,381 Students
59,978 Students
% Hispanic Students
20%
14%
# Black Students
11,069 Students
86,069 Students
% Black Students
24%
21%
# White Students
20,888 Students
241,409 Students
% White Students
46%
58%
# Hawaiian Students
12 Students
542 Students
% Hawaiian Students
n/a
n/a
# Two or more races Students
3,580 Students
20,664 Students
% of Two or more races Students
8%
5%
Students by Grade:
# Students in PK Grade:
1,025
33,031
# Students in K Grade:
3,519
63,063
# Students in 1st Grade:
3,494
63,815
# Students in 2nd Grade:
3,739
64,364
# Students in 3rd Grade:
3,453
58,460
# Students in 4th Grade:
3,502
57,035
# Students in 5th Grade:
3,521
51,187
# Students in 6th Grade:
3,406
8,986
# Students in 7th Grade:
3,262
7,404
# Students in 8th Grade:
3,253
7,287
# Students in 9th Grade:
3,626
701
# Students in 10th Grade:
3,614
718
# Students in 11th Grade:
3,384
617
# Students in 12th Grade:
2,992
763
# Ungraded Students:
-
-
District Revenue and Spending
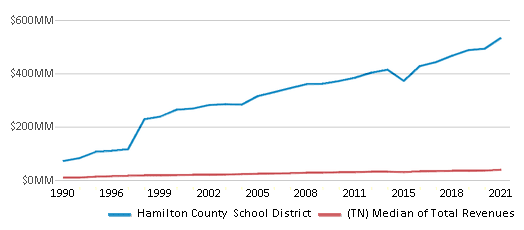
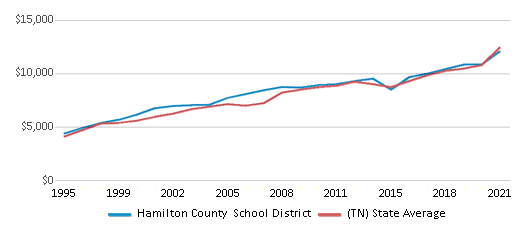
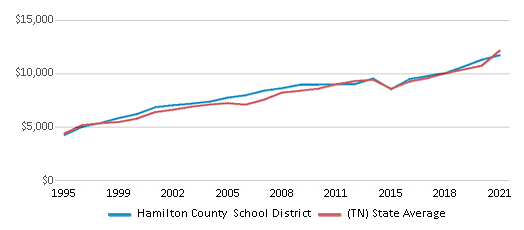
The revenue/student of $11,633 in this school district is less than the state median of $11,979. The school district revenue/student has stayed relatively flat over four school years.
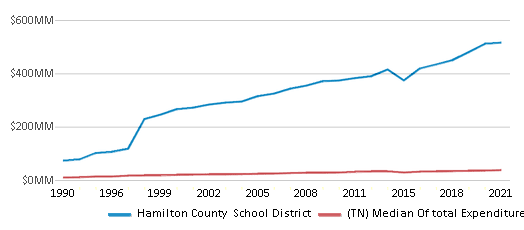
The school district's spending/student of $11,277 is less than the state median of $11,478. The school district spending/student has stayed relatively flat over four school years.
Total Revenue
$533 MM
$12,104 MM
Spending
$516 MM
$11,597 MM
Revenue / Student
$11,633
$11,979
Spending / Student
$11,277
$11,478
Best Hamilton County School District Public Preschools (2025)
School
(Math and Reading Proficiency)
(Math and Reading Proficiency)
Location
Grades
Students
Rank: #11.
Nolan Elementary School
(Math: 84% | Reading: 82%)
Rank:
Rank:
10/
Top 1%10
4435 Shackleford Ridge Rd
Signal Mountain, TN 37377
(423) 886-0898
Signal Mountain, TN 37377
(423) 886-0898
Grades: PK-5
| 727 students
Rank: #22.
Westview Elementary School
(Math: 66% | Reading: 67%)
Rank:
Rank:
10/
Top 5%10
9629 East Brainerd Rd
Chattanooga, TN 37421
(423) 855-6141
Chattanooga, TN 37421
(423) 855-6141
Grades: PK-5
| 615 students
Rank: #33.
Apison Elementary School
(Math: 66% | Reading: 60%)
Rank:
Rank:
10/
Top 10%10
10433 East Brainerd Rd
Apison, TN 37302
(423) 498-6895
Apison, TN 37302
(423) 498-6895
Grades: PK-5
| 621 students
Rank: #44.
Wallace A. Smith Elementary School
(Math: 62% | Reading: 60%)
Rank:
Rank:
10/
Top 10%10
6930 Lebron Sterchi Dr
Ooltewah, TN 37363
(423) 344-1425
Ooltewah, TN 37363
(423) 344-1425
Grades: PK-5
| 592 students
Rank: #55.
Ooltewah Elementary School
(Math: 64% | Reading: 58%)
Rank:
Rank:
10/
Top 10%10
8890 Snowy Owl Rd
Ooltewah, TN 37363
(423) 498-6900
Ooltewah, TN 37363
(423) 498-6900
Grades: PK-5
| 851 students
Rank: #66.
Normal Park Museum Magnet School
Magnet School
(Math: 47% | Reading: 55%)
Rank:
Rank:
9/
Top 20%10
1219 West Mississippi Ave
Chattanooga, TN 37405
(423) 498-6880
Chattanooga, TN 37405
(423) 498-6880
Grades: PK-8
| 801 students
Rank: #77.
Allen Elementary School
(Math: 58% | Reading: 46%)
Rank:
Rank:
9/
Top 20%10
9811 Dallas Hollow Rd
Soddy Daisy, TN 37379
(423) 843-4713
Soddy Daisy, TN 37379
(423) 843-4713
Grades: PK-5
| 444 students
Rank: #8 - 98. - 9.
North Hamilton County Elementary School
(Math: 50-54% | Reading: 45-49%)
Rank:
Rank:
9/
Top 20%10
601 Industrial Blvd
Sale Creek, TN 37373
(423) 332-8848
Sale Creek, TN 37373
(423) 332-8848
Grades: PK-5
| 374 students
Rank: #8 - 98. - 9.
Soddy Elementary School
(Math: 52% | Reading: 47%)
Rank:
Rank:
9/
Top 20%10
260 School St
Soddy Daisy, TN 37379
(423) 332-8823
Soddy Daisy, TN 37379
(423) 332-8823
Grades: PK-5
| 496 students
Rank: #1010.
Montessori Elementary At Highland Park
Charter School
(Math: <50% | Reading: <50%)
Rank:
Rank:
9/
Top 20%10
700 S. Hawthorne St
Chattanooga, TN 37404
(423) 702-7230
Chattanooga, TN 37404
(423) 702-7230
Grades: PK-5
| 310 students
Rank: #1111.
Daisy Elementary School
(Math: 55-59% | Reading: 40-44%)
Rank:
Rank:
9/
Top 20%10
620 Sequoyah Rd
Soddy Daisy, TN 37379
(423) 332-8815
Soddy Daisy, TN 37379
(423) 332-8815
Grades: PK-5
| 364 students
Rank: #1212.
Lookout Valley Elementary School
(Math: 45-49% | Reading: 45-49%)
Rank:
Rank:
9/
Top 20%10
701 Browns Ferry Rd
Chattanooga, TN 37419
(423) 825-7370
Chattanooga, TN 37419
(423) 825-7370
Grades: PK-5
| 261 students
Rank: #1313.
Middle Valley Elementary School
(Math: 48% | Reading: 43%)
Rank:
Rank:
9/
Top 20%10
1609 Thrasher Pike
Hixson, TN 37343
(423) 843-4700
Hixson, TN 37343
(423) 843-4700
Grades: PK-5
| 739 students
Rank: #1414.
Snow Hill Elementary School
(Math: 51% | Reading: 38%)
Rank:
Rank:
8/
Top 30%10
9042 Career Ln
Ooltewah, TN 37363
(423) 344-1456
Ooltewah, TN 37363
(423) 344-1456
Grades: PK-5
| 637 students
Rank: #1515.
Battle Academy For Teaching And Learning
Magnet School
(Math: 40-44% | Reading: 40-44%)
Rank:
Rank:
8/
Top 30%10
1601 Market St
Chattanooga, TN 37408
(423) 498-6860
Chattanooga, TN 37408
(423) 498-6860
Grades: PK-5
| 518 students
Rank: #1616.
Rivermont Elementary School
(Math: 35-39% | Reading: 40-44%)
Rank:
Rank:
8/
Top 30%10
3330 Hixson Pike
Chattanooga, TN 37415
(423) 870-0610
Chattanooga, TN 37415
(423) 870-0610
Grades: PK-5
| 383 students
Rank: #1717.
East Brainerd Elementary School
(Math: 36% | Reading: 38%)
Rank:
Rank:
7/
Top 50%10
7660 Goodwin Rd
Chattanooga, TN 37421
(423) 855-2600
Chattanooga, TN 37421
(423) 855-2600
Grades: PK-5
| 1,172 students
Rank: #1818.
Wolftever Creek Elementary School
(Math: 33% | Reading: 38%)
Rank:
Rank:
7/
Top 50%10
5080 Ooltewah Ringold Rd
Ooltewah, TN 37363
(423) 933-3671
Ooltewah, TN 37363
(423) 933-3671
Grades: PK-5
| 620 students
Rank: #1919.
Red Bank Elementary School
(Math: 31% | Reading: 32%)
Rank:
Rank:
6/
Top 50%10
1100 Mountain Creek Rd
Chattanooga, TN 37405
(423) 874-1917
Chattanooga, TN 37405
(423) 874-1917
Grades: PK-5
| 610 students
Rank: #2020.
Hixson Elementary School
(Math: 31% | Reading: 28%)
Rank:
Rank:
5/
Bottom 50%10
5950 Winding Ln
Hixson, TN 37343
(423) 870-0621
Hixson, TN 37343
(423) 870-0621
Grades: PK-5
| 418 students
Rank: #2121.
Woodmore Elementary School
(Math: 25-29% | Reading: 25-29%)
Rank:
Rank:
5/
Bottom 50%10
800 Woodmore Ln
Chattanooga, TN 37411
(423) 493-0394
Chattanooga, TN 37411
(423) 493-0394
Grades: PK-5
| 349 students
Rank: #2222.
Spring Creek Elementary School
(Math: 26% | Reading: 26%)
Rank:
Rank:
4/
Bottom 50%10
1100 Spring Creek Rd
Chattanooga, TN 37412
(423) 855-6138
Chattanooga, TN 37412
(423) 855-6138
Grades: PK-5
| 697 students
Rank: #2323.
Barger Academy Of Fine Arts
Magnet School
(Math: 25-29% | Reading: 20-24%)
Rank:
Rank:
4/
Bottom 50%10
4808 Brainerd Rd
Chattanooga, TN 37411
(423) 493-0348
Chattanooga, TN 37411
(423) 493-0348
Grades: PK-5
| 362 students
Rank: #2424.
East Ridge Elementary School
(Math: 27% | Reading: 18%)
Rank:
Rank:
3/
Bottom 50%10
1014 John Ross Rd
Chattanooga, TN 37412
(423) 493-9296
Chattanooga, TN 37412
(423) 493-9296
Grades: PK-5
| 917 students
Rank: #2525.
Bess T Shepherd Elementary School
(Math: 26% | Reading: 21%)
Rank:
Rank:
3/
Bottom 50%10
7126 Tyner Rd
Chattanooga, TN 37421
(423) 855-2611
Chattanooga, TN 37421
(423) 855-2611
Grades: PK-5
| 494 students
Rank: #2626.
Clifton Hills Elementary School
(Math: 31% | Reading: 13%)
Rank:
Rank:
3/
Bottom 50%10
1815 East 32nd St
Chattanooga, TN 37407
(423) 493-0357
Chattanooga, TN 37407
(423) 493-0357
Grades: PK-5
| 710 students
Rank: #2727.
Tommie F. Brown Academy
Magnet School
(Math: 10-14% | Reading: 20-24%)
Rank:
Rank:
2/
Bottom 50%10
718 East 8th St
Chattanooga, TN 37403
(423) 498-6870
Chattanooga, TN 37403
(423) 498-6870
Grades: PK-5
| 323 students
Rank: #2828.
Harrison Elementary School
(Math: 12% | Reading: 16%)
Rank:
Rank:
2/
Bottom 50%10
8098 Ferdinand Piech Way
Chattanooga, TN 37416
(423) 344-1428
Chattanooga, TN 37416
(423) 344-1428
Grades: PK-5
| 884 students
Rank: #2929.
Orchard Knob Elementary School
(Math: 10-14% | Reading: 10-14%)
Rank:
Rank:
2/
Bottom 50%10
2000 East 3rd St
Chattanooga, TN 37404
(423) 493-0385
Chattanooga, TN 37404
(423) 493-0385
Grades: PK-5
| 458 students
Rank: #3030.
East Lake Elementary School
(Math: 14% | Reading: 10%)
Rank:
Rank:
2/
Bottom 50%10
3600 13th Ave
Chattanooga, TN 37407
(423) 493-0366
Chattanooga, TN 37407
(423) 493-0366
Grades: PK-5
| 601 students
Rank: #3131.
Calvin Donaldson Environmental Science Academy
Magnet School
(Math: 10-14% | Reading: 6-9%)
Rank:
Rank:
1/
Bottom 50%10
927 West 37th St
Chattanooga, TN 37410
(423) 825-7337
Chattanooga, TN 37410
(423) 825-7337
Grades: PK-5
| 341 students
Rank: #3232.
Hardy Elementary School
(Math: 6-9% | Reading: 6-9%)
Rank:
Rank:
1/
Bottom 50%10
2100 Glass St
Chattanooga, TN 37406
(423) 493-0300
Chattanooga, TN 37406
(423) 493-0300
Grades: PK-5
| 419 students
Recent Articles

Sexual Harassment at Age 6: The Tale of a First Grade Suspension
A six-year old in Aurora, Colorado, was suspended after singing an LMFAO song to a little girl in his class and reportedly “shaking his booty.” We look at the case and the sexual harassment problem in public schools today.

How Scaffolding Could Change the Way Your Child Learns
This article explores the concept of instructional scaffolding, a teaching method that enhances learning by breaking down complex tasks into manageable parts. It highlights how scaffolding supports students in developing critical thinking skills and becoming more independent learners. The article discusses the benefits of scaffolding, including improved engagement and reduced anxiety, and provides strategies for its implementation across various educational levels.

February 05, 2025
Understanding the U.S. Department of Education: Structure, Impact, and EvolutionWe explore how the Department of Education shapes American education, from its cabinet-level leadership to its impact on millions of students, written for general audiences seeking clarity on this vital institution.


