Top Rankings
Rutherford County School District ranks among the top 20% of public school district in Tennessee for:
Category
Attribute
Overall Rank
Highest overall rank (Top 20%)
Reading/Language Arts Proficiency
Highest reading/language arts proficiency (Top 20%)
Diversity
Most diverse schools (Top 1%)
Community Size
Largest student body (number of students) (Top 1%)
For the 2025 school year, there are 23 public preschools serving 19,034 students in Rutherford County School District. This district's average pre testing ranking is 8/10, which is in the top 30% of public pre schools in Tennessee.
Public Preschools in Rutherford County School District have an average math proficiency score of 42% (versus the Tennessee public pre school average of 37%), and reading proficiency score of 38% (versus the 37% statewide average).
Minority enrollment is 50% of the student body (majority Hispanic), which is more than the Tennessee public preschool average of 42% (majority Black).
Overview
This School District
This State (TN)
# Schools
51 Schools
890 Schools
# Students
51,595 Students
417,431 Students
# Teachers
3,358 Teachers
28,312 Teachers
Student : Teacher Ratio
15:1
15:1
District Rank
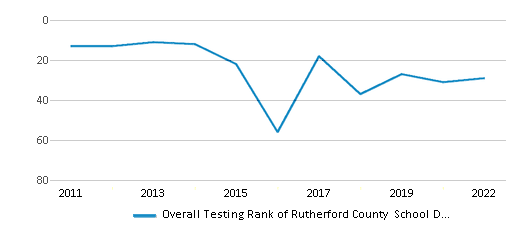
Rutherford County School District, which is ranked within the top 20% of all 147 school districts in Tennessee (based off of combined math and reading proficiency testing data) for the 2021-2022 school year.
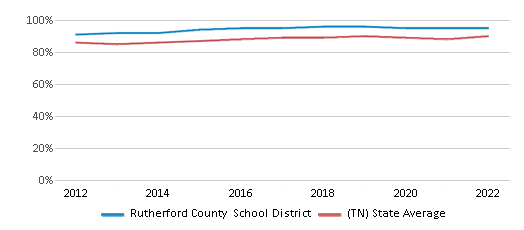
The school district's graduation rate of 95% has stayed relatively flat over five school years.
Overall District Rank
#29 out of 147 school districts
(Top 20%)
(Top 20%)
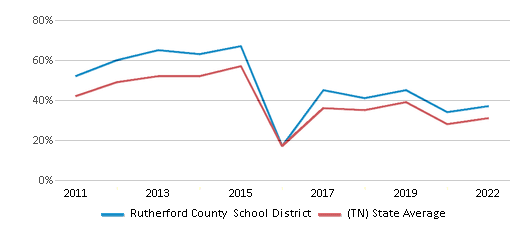
Math Test Scores (% Proficient)
37%
31%
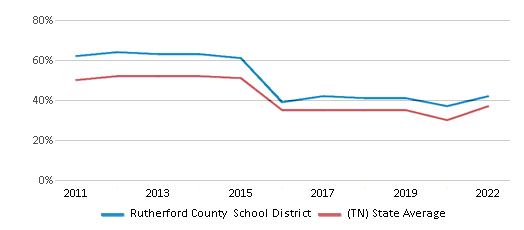
Reading/Language Arts Test Scores (% Proficient)
42%
37%
Science Test Scores (% Proficient)
45%
40%
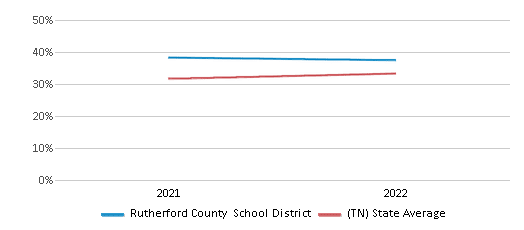
Graduation Rate
95%
90%
Students by Ethnicity:
Diversity Score
0.67
0.61
# American Indian Students
97 Students
758 Students
% American Indian Students
n/a
n/a
# Asian Students
2,246 Students
8,008 Students
% Asian Students
4%
2%
# Hispanic Students
11,882 Students
59,978 Students
% Hispanic Students
23%
14%
# Black Students
9,082 Students
86,069 Students
% Black Students
18%
21%
# White Students
25,594 Students
241,409 Students
% White Students
50%
58%
# Hawaiian Students
84 Students
542 Students
% Hawaiian Students
n/a
n/a
# Two or more races Students
2,610 Students
20,664 Students
% of Two or more races Students
5%
5%
Students by Grade:
# Students in PK Grade:
858
33,031
# Students in K Grade:
2,867
63,063
# Students in 1st Grade:
3,017
63,815
# Students in 2nd Grade:
3,098
64,364
# Students in 3rd Grade:
3,109
58,460
# Students in 4th Grade:
3,223
57,035
# Students in 5th Grade:
3,356
51,187
# Students in 6th Grade:
4,146
8,986
# Students in 7th Grade:
4,536
7,404
# Students in 8th Grade:
4,623
7,287
# Students in 9th Grade:
4,647
701
# Students in 10th Grade:
4,927
718
# Students in 11th Grade:
4,772
617
# Students in 12th Grade:
4,416
763
# Ungraded Students:
-
-
District Revenue and Spending
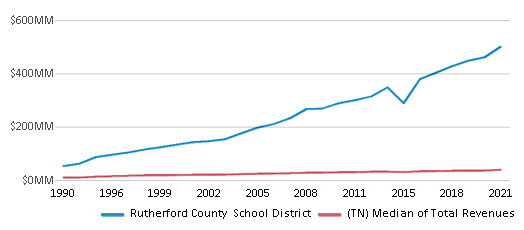
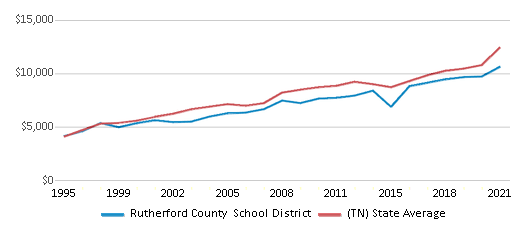
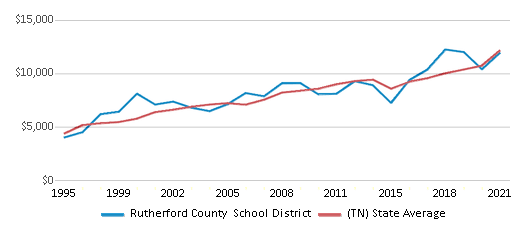
The revenue/student of $9,718 in this school district is less than the state median of $11,979. The school district revenue/student has declined by 8% over four school years.
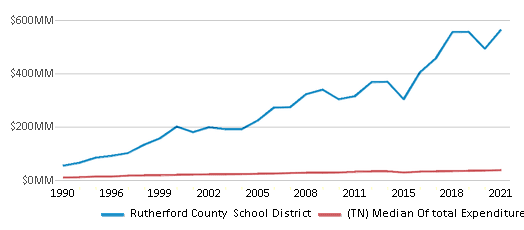
The school district's spending/student of $10,924 is less than the state median of $11,478. The school district spending/student has declined by 8% over four school years.
Total Revenue
$501 MM
$12,104 MM
Spending
$564 MM
$11,597 MM
Revenue / Student
$9,718
$11,979
Spending / Student
$10,924
$11,478
Best Rutherford County School District Public Preschools (2025)
School
(Math and Reading Proficiency)
(Math and Reading Proficiency)
Location
Grades
Students
Rank: #11.
Stewarts Creek Elementary School
(Math: 63% | Reading: 52%)
Rank:
Rank:
10/
Top 10%10
200 Red Hawk Pkwy
Smyrna, TN 37167
(615) 904-6750
Smyrna, TN 37167
(615) 904-6750
Grades: PK-5
| 1,349 students
Rank: #22.
Eagleville School
(Math: 55% | Reading: 57%)
Rank:
Rank:
10/
Top 10%10
500 Hwy 99
Eagleville, TN 37060
(615) 274-6336
Eagleville, TN 37060
(615) 274-6336
Grades: PK-12
| 1,011 students
Rank: #33.
Lascassas Elementary School
(Math: 53% | Reading: 55%)
Rank:
Rank:
9/
Top 20%10
6300 Lascassas Pike
Lascassas, TN 37085
(615) 893-0758
Lascassas, TN 37085
(615) 893-0758
Grades: PK-5
| 611 students
Rank: #44.
Rockvale Elementary School
(Math: 56% | Reading: 50%)
Rank:
Rank:
9/
Top 20%10
6550 Hwy 99
Rockvale, TN 37153
(615) 904-3881
Rockvale, TN 37153
(615) 904-3881
Grades: PK-5
| 983 students
Rank: #55.
Christiana Elementary School
(Math: 51% | Reading: 48%)
Rank:
Rank:
9/
Top 20%10
4701 Shelbyville Hwy
Christiana, TN 37037
(615) 896-0614
Christiana, TN 37037
(615) 896-0614
Grades: PK-5
| 645 students
Rank: #66.
Wilson Elementary School
(Math: 56% | Reading: 45%)
Rank:
Rank:
9/
Top 20%10
1545 Cutoff Rd
Murfreesboro, TN 37129
(615) 904-3840
Murfreesboro, TN 37129
(615) 904-3840
Grades: PK-5
| 664 students
Rank: #77.
Barfield Elementary School
(Math: 49% | Reading: 45%)
Rank:
Rank:
9/
Top 20%10
350 Veterans Parkway
Murfreesboro, TN 37128
(615) 904-3810
Murfreesboro, TN 37128
(615) 904-3810
Grades: PK-5
| 965 students
Rank: #88.
Brown's Chapel Elementary School
(Math: 49% | Reading: 44%)
Rank:
Rank:
9/
Top 20%10
6128 Baker Rd
Murfreesboro, TN 37129
(615) 904-6755
Murfreesboro, TN 37129
(615) 904-6755
Grades: PK-5
| 841 students
Rank: #99.
Stewartsboro Elementary School
(Math: 49% | Reading: 39%)
Rank:
Rank:
8/
Top 30%10
10479 Old Nashville Hwy
Smyrna, TN 37167
(615) 904-6705
Smyrna, TN 37167
(615) 904-6705
Grades: PK-5
| 800 students
Rank: #1010.
Buchanan Elementary School
(Math: 47% | Reading: 40%)
Rank:
Rank:
8/
Top 30%10
6050 Manchester Hwy
Murfreesboro, TN 37127
(615) 893-3651
Murfreesboro, TN 37127
(615) 893-3651
Grades: PK-5
| 463 students
Rank: #1111.
Walter Hill Elementary School
(Math: 42% | Reading: 41%)
Rank:
Rank:
8/
Top 30%10
6309 Lebanon Pike
Murfreesboro, TN 37129
(615) 893-8046
Murfreesboro, TN 37129
(615) 893-8046
Grades: PK-5
| 585 students
Rank: #1212.
Cedar Grove Elementary School
(Math: 47% | Reading: 36%)
Rank:
Rank:
8/
Top 30%10
354 Chaney Rd
Smyrna, TN 37167
(615) 904-3777
Smyrna, TN 37167
(615) 904-3777
Grades: PK-5
| 902 students
Rank: #1313.
Blackman Elementary School
(Math: 38% | Reading: 38%)
Rank:
Rank:
7/
Top 50%10
586 Fortress Blvd
Murfreesboro, TN 37128
(615) 904-3795
Murfreesboro, TN 37128
(615) 904-3795
Grades: PK-5
| 1,068 students
Rank: #1414.
Rock Springs Elementary School
(Math: 36% | Reading: 39%)
Rank:
Rank:
7/
Top 50%10
1000 Waldron Rd
La Vergne, TN 37086
(615) 904-3820
La Vergne, TN 37086
(615) 904-3820
Grades: PK-5
| 1,232 students
Rank: #1515.
Plainview Elementary School
(Math: 43% | Reading: 31%)
Rank:
Rank:
6/
Top 50%10
7182 Otter Pond Way
Christiana, TN 37037
(615) 904-6790
Christiana, TN 37037
(615) 904-6790
Grades: PK-5
| 661 students
Rank: #1616.
John Colemon Elementary School
(Math: 40% | Reading: 30%)
Rank:
Rank:
6/
Top 50%10
1098 Espey Dr
Smyrna, TN 37167
(615) 904-6740
Smyrna, TN 37167
(615) 904-6740
Grades: PK-5
| 625 students
Rank: #17 - 1817. - 18.
Kittrell Elementary School
(Math: 30-34% | Reading: 30-34%)
Rank:
Rank:
6/
Top 50%10
7801 Old Woodbury Hwy
Readyville, TN 37149
(615) 893-7604
Readyville, TN 37149
(615) 893-7604
Grades: PK-5
| 356 students
Rank: #17 - 1817. - 18.
Rocky Fork Elementary School
(Math: 32% | Reading: 32%)
Rank:
Rank:
6/
Top 50%10
200 Thunderstorm Ln
Smyrna, TN 37167
(615) 904-3790
Smyrna, TN 37167
(615) 904-3790
Grades: PK-5
| 967 students
Rank: #1919.
Lavergne Lake Elementary School
(Math: 27% | Reading: 22%)
Rank:
Rank:
4/
Bottom 50%10
201 David's Way
La Vergne, TN 37086
(615) 904-6730
La Vergne, TN 37086
(615) 904-6730
Grades: PK-5
| 885 students
Rank: #2020.
Smyrna Primary
(Math: 20% | Reading: 27%)
Rank:
Rank:
4/
Bottom 50%10
200 Walnut St
Smyrna, TN 37167
(615) 459-3161
Smyrna, TN 37167
(615) 459-3161
Grades: PK-5
| 597 students
Rank: #2121.
Roy L Waldron Elementary School
(Math: 23% | Reading: 24%)
Rank:
Rank:
4/
Bottom 50%10
125 Floyd Mayfield Dr
La Vergne, TN 37086
(615) 904-3785
La Vergne, TN 37086
(615) 904-3785
Grades: PK-5
| 1,332 students
Rank: #2222.
Smyrna Elementary School
(Math: 28% | Reading: 19%)
Rank:
Rank:
4/
Bottom 50%10
1001 Sam Davis Rd
Smyrna, TN 37167
(615) 904-6725
Smyrna, TN 37167
(615) 904-6725
Grades: PK-5
| 767 students
Rank: #2323.
David Youree Elementary School
(Math: 18% | Reading: 20%)
Rank:
Rank:
3/
Bottom 50%10
250 Todd Ln
Smyrna, TN 37167
(615) 459-3492
Smyrna, TN 37167
(615) 459-3492
Grades: PK-5
| 725 students
Recent Articles

What Is A Charter School?
Explore the world of charter schools in this comprehensive guide. Learn about their history, how they operate, and the pros and cons of this educational innovation. Discover key facts about charter schools, including admission policies, demographics, and funding, as well as what to look for when considering a charter school for your child.

10 Reasons Why High School Sports Benefit Students
Discover the 10 compelling reasons why high school sports are beneficial for students. This comprehensive article explores how athletics enhance academic performance, foster personal growth, and develop crucial life skills. From improved fitness and time management to leadership development and community representation, learn why participating in high school sports can be a game-changer for students' overall success and well-being.

February 05, 2025
Understanding the U.S. Department of Education: Structure, Impact, and EvolutionWe explore how the Department of Education shapes American education, from its cabinet-level leadership to its impact on millions of students, written for general audiences seeking clarity on this vital institution.


