Top Rankings
Amarillo Independent School District ranks among the top 20% of public school district in Texas for:
Category
Attribute
Diversity
Most diverse schools (Top 1%)
Community Size
Largest student body (number of students) (Top 1%)
For the 2025 school year, there are 36 public preschools serving 14,250 students in Amarillo Independent School District. This district's average pre testing ranking is 7/10, which is in the top 50% of public pre schools in Texas.
Public Preschools in Amarillo Independent School District have an average math proficiency score of 48% (versus the Texas public pre school average of 43%), and reading proficiency score of 57% (versus the 53% statewide average).
Minority enrollment is 68% of the student body (majority Hispanic), which is less than the Texas public preschool average of 76% (majority Hispanic).
Overview
This School District
This State (TX)
# Schools
55 Schools
4,192 Schools
# Students
29,729 Students
2,151,418 Students
# Teachers
2,054 Teachers
147,942 Teachers
Student : Teacher Ratio
15:1
15:1
District Rank
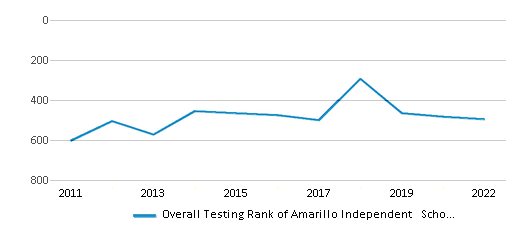
Amarillo Independent School District, which is ranked #495 of all 1,196 school districts in Texas (based off of combined math and reading proficiency testing data) for the 2021-2022 school year.
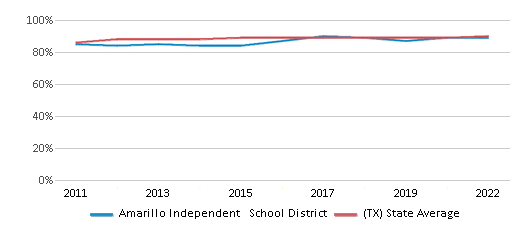
The school district's graduation rate of 89% has increased from 87% over five school years.
Overall District Rank
#496 out of 1204 school districts
(Top 50%)
(Top 50%)
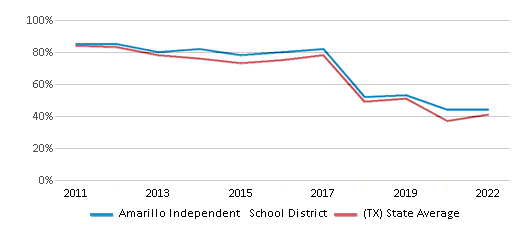
Math Test Scores (% Proficient)
44%
41%
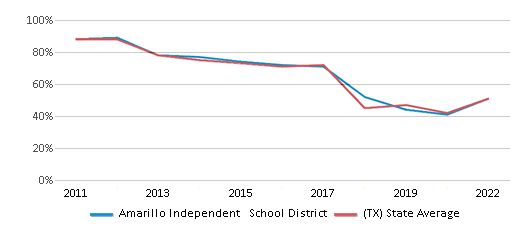
Reading/Language Arts Test Scores (% Proficient)
51%
51%
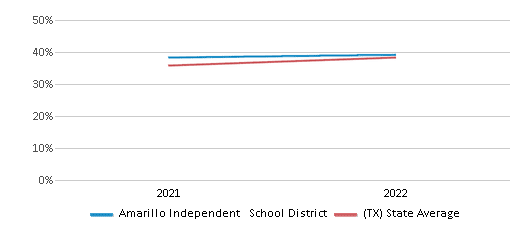
Science Test Scores (% Proficient)
47%
46%
Graduation Rate
89%
90%
Students by Ethnicity:
Diversity Score
0.65
0.63
# American Indian Students
163 Students
6,302 Students
% American Indian Students
1%
n/a
# Asian Students
1,392 Students
104,203 Students
% Asian Students
5%
5%
# Hispanic Students
14,091 Students
1,180,208 Students
% Hispanic Students
47%
55%
# Black Students
3,119 Students
275,255 Students
% Black Students
10%
13%
# White Students
10,009 Students
509,082 Students
% White Students
34%
24%
# Hawaiian Students
32 Students
3,291 Students
% Hawaiian Students
n/a
n/a
# Two or more races Students
923 Students
73,077 Students
% of Two or more races Students
3%
3%
Students by Grade:
# Students in PK Grade:
1,769
275,832
# Students in K Grade:
2,046
307,607
# Students in 1st Grade:
2,077
310,480
# Students in 2nd Grade:
2,105
317,113
# Students in 3rd Grade:
2,236
300,451
# Students in 4th Grade:
2,263
295,281
# Students in 5th Grade:
2,199
258,890
# Students in 6th Grade:
2,102
33,806
# Students in 7th Grade:
2,199
14,241
# Students in 8th Grade:
2,185
12,959
# Students in 9th Grade:
2,483
7,002
# Students in 10th Grade:
2,179
6,366
# Students in 11th Grade:
2,044
5,781
# Students in 12th Grade:
1,842
5,609
# Ungraded Students:
-
-
District Revenue and Spending
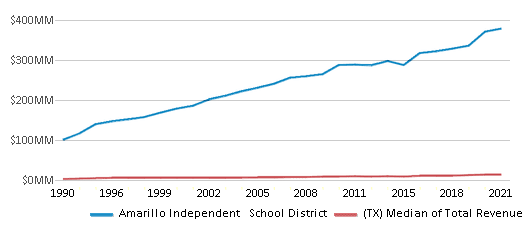
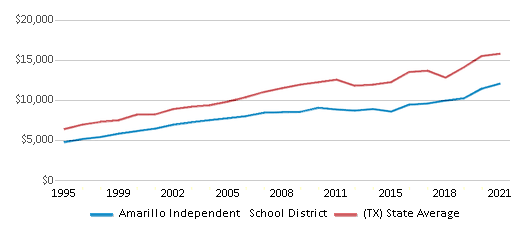
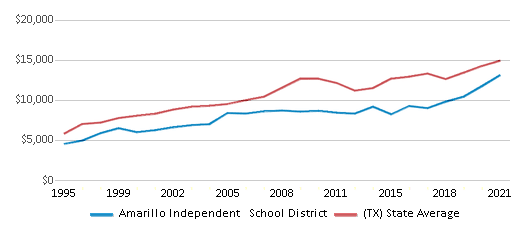
The revenue/student of $12,743 in this school district is less than the state median of $13,387. The school district revenue/student has grown by 5% over four school years.
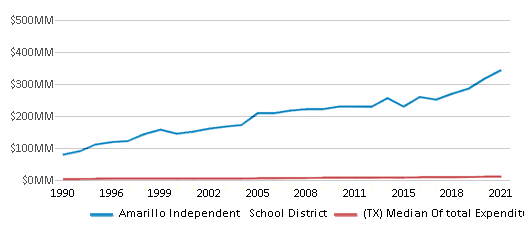
The school district's spending/student of $13,853 is less than the state median of $14,116. The school district spending/student has grown by 5% over four school years.
Total Revenue
$379 MM
$74,029 MM
Spending
$412 MM
$78,063 MM
Revenue / Student
$12,743
$13,387
Spending / Student
$13,853
$14,116
Best Amarillo Independent School District Public Preschools (2025)
School
(Math and Reading Proficiency)
(Math and Reading Proficiency)
Location
Grades
Students
Rank: #11.
Woodlands Elementary School
(Math: 75-79% | Reading: 75-79%)
Rank:
Rank:
10/
Top 5%10
2501 N Coulter
Amarillo, TX 79106
(806) 326-5800
Amarillo, TX 79106
(806) 326-5800
Grades: PK-4
| 454 students
Rank: #22.
Sleepy Hollow Elementary School
(Math: 68% | Reading: 80%)
Rank:
Rank:
10/
Top 10%10
3435 Reeder
Amarillo, TX 79121
(806) 326-5300
Amarillo, TX 79121
(806) 326-5300
Grades: PK-5
| 515 students
Rank: #33.
Windsor Elementary School
(Math: 62% | Reading: 73%)
Rank:
Rank:
10/
Top 10%10
6700 Hyde Pkwy
Amarillo, TX 79109
(806) 326-5700
Amarillo, TX 79109
(806) 326-5700
Grades: PK-5
| 440 students
Rank: #44.
Belmar Elementary School
(Math: 65-69% | Reading: 65-69%)
Rank:
Rank:
9/
Top 20%10
6324 Adirondack
Amarillo, TX 79106
(806) 326-4050
Amarillo, TX 79106
(806) 326-4050
Grades: PK-5
| 378 students
Rank: #55.
Wolflin Elementary School
(Math: 55-59% | Reading: 70-74%)
Rank:
Rank:
9/
Top 20%10
2026 S Hughes
Amarillo, TX 79109
(806) 371-5790
Amarillo, TX 79109
(806) 371-5790
Grades: PK-5
| 316 students
Rank: #6 - 76. - 7.
Puckett Elementary School
(Math: 60-64% | Reading: 65-69%)
Rank:
Rank:
9/
Top 20%10
6700 Oakhurst
Amarillo, TX 79109
(806) 326-5050
Amarillo, TX 79109
(806) 326-5050
Grades: PK-5
| 335 students
Rank: #6 - 76. - 7.
Whittier Elementary School
(Math: 62% | Reading: 67%)
Rank:
Rank:
9/
Top 20%10
2004 N Marrs
Amarillo, TX 79107
(806) 326-5600
Amarillo, TX 79107
(806) 326-5600
Grades: PK-5
| 413 students
Rank: #88.
Emerson Elementary School
(Math: 65-69% | Reading: 55-59%)
Rank:
Rank:
9/
Top 20%10
600 N Cleveland
Amarillo, TX 79107
(806) 326-4350
Amarillo, TX 79107
(806) 326-4350
Grades: PK-5
| 512 students
Rank: #99.
Glenwood Elementary School
(Math: 55-59% | Reading: 60-64%)
Rank:
Rank:
9/
Top 20%10
2407 S Houston
Amarillo, TX 79103
(806) 326-4450
Amarillo, TX 79103
(806) 326-4450
Grades: PK-5
| 475 students
Rank: #1010.
Pleasant Valley Elementary School
(Math: 55-59% | Reading: 55-59%)
Rank:
Rank:
8/
Top 30%10
4413 River Dr
Amarillo, TX 79108
(806) 326-5000
Amarillo, TX 79108
(806) 326-5000
Grades: PK-5
| 199 students
Rank: #1111.
Tradewind Elementary School
(Math: 49% | Reading: 63%)
Rank:
Rank:
8/
Top 30%10
4300 Williams
Amarillo, TX 79118
(806) 326-5500
Amarillo, TX 79118
(806) 326-5500
Grades: PK-5
| 683 students
Rank: #12 - 1312. - 13.
Paramount Terrace Elementary School
(Math: 50-54% | Reading: 55-59%)
Rank:
Rank:
8/
Top 30%10
3906 Cougar Dr
Amarillo, TX 79109
(806) 326-4950
Amarillo, TX 79109
(806) 326-4950
Grades: PK-5
| 308 students
Rank: #12 - 1312. - 13.
South Georgia Elementary School
(Math: 50-54% | Reading: 55-59%)
Rank:
Rank:
8/
Top 30%10
5018 Susan Dr
Amarillo, TX 79110
(806) 326-5350
Amarillo, TX 79110
(806) 326-5350
Grades: PK-5
| 404 students
Rank: #14 - 1514. - 15.
Sunrise Elementary School
(Math: 45-49% | Reading: 60-64%)
Rank:
Rank:
8/
Top 30%10
5123 E 14th
Amarillo, TX 79104
(806) 326-5450
Amarillo, TX 79104
(806) 326-5450
Grades: PK-5
| 222 students
Rank: #14 - 1514. - 15.
Western Plateau Elementary School
(Math: 45-49% | Reading: 60-64%)
Rank:
Rank:
8/
Top 30%10
4927 Shawnee
Amarillo, TX 79109
(806) 326-5550
Amarillo, TX 79109
(806) 326-5550
Grades: PK-5
| 434 students
Rank: #1616.
Coronado Elementary School
(Math: 40-44% | Reading: 65-69%)
Rank:
Rank:
8/
Top 30%10
3210 Wimberly Rd
Amarillo, TX 79109
(806) 354-4600
Amarillo, TX 79109
(806) 354-4600
Grades: PK-5
| 384 students
Rank: #1717.
Olsen Park Elementary School
(Math: 47% | Reading: 59%)
Rank:
Rank:
8/
Top 30%10
2409 Anna
Amarillo, TX 79106
(806) 326-4900
Amarillo, TX 79106
(806) 326-4900
Grades: PK-5
| 384 students
Rank: #1818.
Avondale Elementary School
(Math: 53% | Reading: 54%)
Rank:
Rank:
8/
Top 30%10
1500 Avondale
Amarillo, TX 79106
(806) 326-4000
Amarillo, TX 79106
(806) 326-4000
Grades: PK-5
| 489 students
Rank: #1919.
Wills Elementary School
(Math: 45-49% | Reading: 55-59%)
Rank:
Rank:
8/
Top 30%10
3500 W 11th
Amarillo, TX 79106
(806) 326-5650
Amarillo, TX 79106
(806) 326-5650
Grades: PK-5
| 484 students
Rank: #2020.
Ridgecrest Elementary School
(Math: 45% | Reading: 59%)
Rank:
Rank:
7/
Top 50%10
5306 W 37th
Amarillo, TX 79109
(806) 326-5100
Amarillo, TX 79109
(806) 326-5100
Grades: PK-5
| 400 students
Rank: #2121.
South Lawn Elementary School
(Math: 40-44% | Reading: 55-59%)
Rank:
Rank:
7/
Top 50%10
4719 S Bowie
Amarillo, TX 79110
(806) 326-5401
Amarillo, TX 79110
(806) 326-5401
Grades: PK-5
| 315 students
Rank: #2222.
Bivins Elementary School
(Math: 39% | Reading: 58%)
Rank:
Rank:
7/
Top 50%10
1500 S Fannin
Amarillo, TX 79102
(806) 326-4100
Amarillo, TX 79102
(806) 326-4100
Grades: PK-5
| 420 students
Rank: #2323.
Forest Hill Elementary School
(Math: 50% | Reading: 48%)
Rank:
Rank:
7/
Top 50%10
3515 Amarillo Blvd E
Amarillo, TX 79107
(806) 326-4400
Amarillo, TX 79107
(806) 326-4400
Grades: PK-5
| 476 students
Rank: #2424.
Eastridge Elementary School
(Math: 40% | Reading: 53%)
Rank:
Rank:
6/
Top 50%10
1314 Evergreen
Amarillo, TX 79107
(806) 326-4300
Amarillo, TX 79107
(806) 326-4300
Grades: PK-5
| 550 students
Rank: #2525.
Landergin Elementary School
(Math: 50-54% | Reading: 40-44%)
Rank:
Rank:
6/
Top 50%10
3209 S Taylor
Amarillo, TX 79110
(806) 326-4650
Amarillo, TX 79110
(806) 326-4650
Grades: PK-5
| 237 students
Rank: #2626.
Humphrey's Highland Elementary School
(Math: 41% | Reading: 50%)
Rank:
Rank:
6/
Top 50%10
3900 E 13th
Amarillo, TX 79104
(806) 326-4550
Amarillo, TX 79104
(806) 326-4550
Grades: PK-5
| 539 students
Rank: #2727.
Park Hills Elementary School
(Math: 40-44% | Reading: 45-49%)
Rank:
Rank:
6/
Top 50%10
119 N E 15th
Amarillo, TX 79107
(806) 326-4750
Amarillo, TX 79107
(806) 326-4750
Grades: PK-5
| 229 students
Rank: #2828.
Rogers Elementary School
(Math: 37% | Reading: 50%)
Rank:
Rank:
5/
Bottom 50%10
920 N Mirror
Amarillo, TX 79107
(806) 326-5150
Amarillo, TX 79107
(806) 326-5150
Grades: PK-5
| 483 students
Rank: #2929.
Lamar Elementary School
(Math: 40-44% | Reading: 40-44%)
Rank:
Rank:
5/
Bottom 50%10
3800 Lipscomb
Amarillo, TX 79110
(806) 326-4600
Amarillo, TX 79110
(806) 326-4600
Grades: PK-5
| 286 students
Rank: #30 - 3130. - 31.
Mesa Verde Elementary School
(Math: 35-39% | Reading: 40-44%)
Rank:
Rank:
4/
Bottom 50%10
4011 Beaver
Amarillo, TX 79107
(806) 326-4800
Amarillo, TX 79107
(806) 326-4800
Grades: PK-5
| 383 students
Rank: #30 - 3130. - 31.
Sanborn Elementary School
(Math: 35-39% | Reading: 40-44%)
Rank:
Rank:
4/
Bottom 50%10
700 S Roberts
Amarillo, TX 79102
(806) 326-5250
Amarillo, TX 79102
(806) 326-5250
Grades: PK-5
| 394 students
Rank: #3232.
San Jacinto Elementary School
(Math: 33% | Reading: 40%)
Rank:
Rank:
3/
Bottom 50%10
3400 W 4th
Amarillo, TX 79106
(806) 326-5200
Amarillo, TX 79106
(806) 326-5200
Grades: PK-5
| 384 students
Rank: #3333.
Oak Dale Elementary School
(Math: 25-29% | Reading: 40-44%)
Rank:
Rank:
3/
Bottom 50%10
2711 S Hill
Amarillo, TX 79103
(806) 326-4850
Amarillo, TX 79103
(806) 326-4850
Grades: PK-5
| 339 students
Rank: #3434.
Lawndale Elementary School
(Math: 20-24% | Reading: 40-44%)
Rank:
Rank:
3/
Bottom 50%10
2215 S Bivins
Amarillo, TX 79103
(806) 326-4700
Amarillo, TX 79103
(806) 326-4700
Grades: PK-5
| 362 students
Rank: #3535.
Hamlet Elementary School
(Math: 6-9% | Reading: 20-24%)
Rank:
Rank:
1/
Bottom 50%10
705 Sycamore
Amarillo, TX 79107
(806) 326-4500
Amarillo, TX 79107
(806) 326-4500
Grades: PK-5
| 290 students
Show 1 more public schools in Amarillo Independent School District (out of 36 total schools)
Loading...
Recent Articles

What Is A Charter School?
Explore the world of charter schools in this comprehensive guide. Learn about their history, how they operate, and the pros and cons of this educational innovation. Discover key facts about charter schools, including admission policies, demographics, and funding, as well as what to look for when considering a charter school for your child.

10 Reasons Why High School Sports Benefit Students
Discover the 10 compelling reasons why high school sports are beneficial for students. This comprehensive article explores how athletics enhance academic performance, foster personal growth, and develop crucial life skills. From improved fitness and time management to leadership development and community representation, learn why participating in high school sports can be a game-changer for students' overall success and well-being.

February 05, 2025
Understanding the U.S. Department of Education: Structure, Impact, and EvolutionWe explore how the Department of Education shapes American education, from its cabinet-level leadership to its impact on millions of students, written for general audiences seeking clarity on this vital institution.


