Top Rankings
Anna Independent School District ranks among the top 20% of public school district in Texas for:
Category
Attribute
Graduation Rate
Highest graduation rate (Top 10%)
Diversity
Most diverse schools (Top 1%)
Community Size
Largest student body (number of students) (Top 1%)
For the 2025 school year, there are 5 public preschools serving 2,864 students in Anna Independent School District. This district's average pre testing ranking is 5/10, which is in the bottom 50% of public pre schools in Texas.
Public Preschools in Anna Independent School District have an average math proficiency score of 40% (versus the Texas public pre school average of 43%), and reading proficiency score of 52% (versus the 53% statewide average).
Minority enrollment is 63% of the student body (majority Hispanic), which is less than the Texas public preschool average of 76% (majority Hispanic).
Overview
This School District
This State (TX)
# Schools
11 Schools
4,192 Schools
# Students
5,574 Students
2,151,418 Students
# Teachers
344 Teachers
147,942 Teachers
Student : Teacher Ratio
16:1
16:1
District Rank
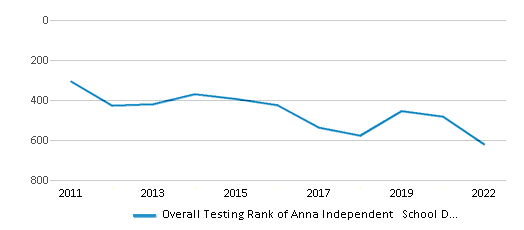
Anna Independent School District, which is ranked #608 of all 1,196 school districts in Texas (based off of combined math and reading proficiency testing data) for the 2021-2022 school year.
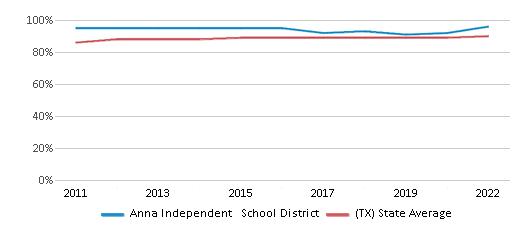
The school district's graduation rate of 96% has increased from 95% over five school years.
Overall District Rank
#622 out of 1204 school districts
(Bottom 50%)
(Bottom 50%)
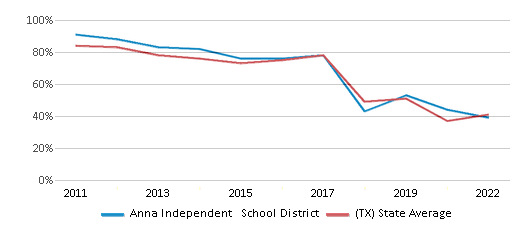
Math Test Scores (% Proficient)
39%
41%
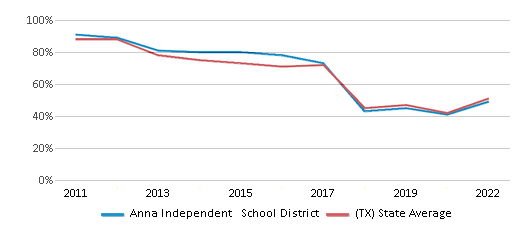
Reading/Language Arts Test Scores (% Proficient)
49%
51%
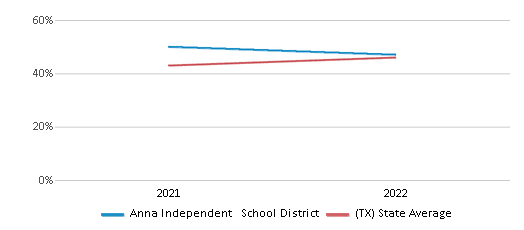
Science Test Scores (% Proficient)
47%
46%
Graduation Rate
96%
90%
Students by Ethnicity:
Diversity Score
0.72
0.63
# American Indian Students
21 Students
6,302 Students
% American Indian Students
n/a
n/a
# Asian Students
154 Students
104,203 Students
% Asian Students
3%
5%
# Hispanic Students
1,731 Students
1,180,208 Students
% Hispanic Students
31%
55%
# Black Students
1,278 Students
275,255 Students
% Black Students
23%
13%
# White Students
2,013 Students
509,082 Students
% White Students
36%
24%
# Hawaiian Students
10 Students
3,291 Students
% Hawaiian Students
n/a
n/a
# Two or more races Students
367 Students
73,077 Students
% of Two or more races Students
7%
3%
Students by Grade:
# Students in PK Grade:
337
275,832
# Students in K Grade:
423
307,607
# Students in 1st Grade:
416
310,480
# Students in 2nd Grade:
444
317,113
# Students in 3rd Grade:
447
300,451
# Students in 4th Grade:
414
295,281
# Students in 5th Grade:
383
258,890
# Students in 6th Grade:
390
33,806
# Students in 7th Grade:
403
14,241
# Students in 8th Grade:
410
12,959
# Students in 9th Grade:
411
7,002
# Students in 10th Grade:
430
6,366
# Students in 11th Grade:
355
5,781
# Students in 12th Grade:
311
5,609
# Ungraded Students:
-
-
District Revenue and Spending
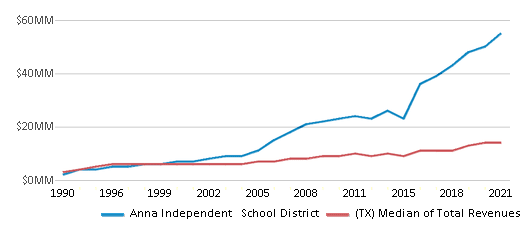
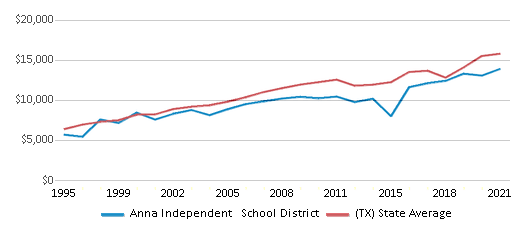
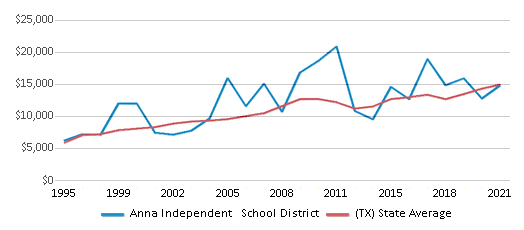
The revenue/student of $9,928 in this school district is less than the state median of $13,387. The school district revenue/student has declined by 28% over four school years.
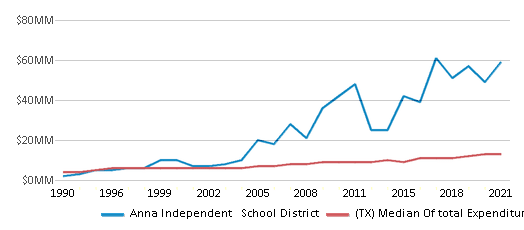
The school district's spending/student of $10,541 is less than the state median of $14,116. The school district spending/student has declined by 28% over four school years.
Total Revenue
$55 MM
$74,029 MM
Spending
$59 MM
$78,063 MM
Revenue / Student
$9,928
$13,387
Spending / Student
$10,541
$14,116
Best Anna Independent School District Public Preschools (2025)
School
(Math and Reading Proficiency)
(Math and Reading Proficiency)
Location
Grades
Students
Rank: #11.
Judith L Harlow Elementary School
(Math: 46% | Reading: 54%)
Rank:
Rank:
7/
Top 50%10
1224 Leonard Ave
Anna, TX 75409
(972) 924-1320
Anna, TX 75409
(972) 924-1320
Grades: PK-5
| 590 students
Rank: #22.
Sue Evelyn Rattan Elementary School
(Math: 36% | Reading: 54%)
Rank:
Rank:
6/
Top 50%10
1221 S Ferguson Pkwy
Anna, TX 75409
(972) 924-1400
Anna, TX 75409
(972) 924-1400
Grades: PK-5
| 665 students
Rank: #33.
Joe K Bryant Elementary School
(Math: 36% | Reading: 49%)
Rank:
Rank:
5/
Bottom 50%10
2725 Bryant Farm Rd
Anna, TX 75409
(972) 924-1300
Anna, TX 75409
(972) 924-1300
Grades: PK-5
| 710 students
Rank: n/an/a
601 S Sherley Ave
Anna, TX 75409
(972) 924-1340
Anna, TX 75409
(972) 924-1340
Grades: PK
| 104 students
Rank: n/an/a
3000 Fm 2862
Anna, TX 75409
(972) 924-1000
Anna, TX 75409
(972) 924-1000
Grades: PK-5
| 795 students
Recent Articles

What Is A Charter School?
Explore the world of charter schools in this comprehensive guide. Learn about their history, how they operate, and the pros and cons of this educational innovation. Discover key facts about charter schools, including admission policies, demographics, and funding, as well as what to look for when considering a charter school for your child.

10 Reasons Why High School Sports Benefit Students
Discover the 10 compelling reasons why high school sports are beneficial for students. This comprehensive article explores how athletics enhance academic performance, foster personal growth, and develop crucial life skills. From improved fitness and time management to leadership development and community representation, learn why participating in high school sports can be a game-changer for students' overall success and well-being.

February 05, 2025
Understanding the U.S. Department of Education: Structure, Impact, and EvolutionWe explore how the Department of Education shapes American education, from its cabinet-level leadership to its impact on millions of students, written for general audiences seeking clarity on this vital institution.


