Top Rankings
BASIS Texas School District ranks among the top 20% of public school district in Texas for:
Category
Attribute
Overall Rank
Highest overall rank (Top 1%)
Math Proficiency
Highest math proficiency (Top 1%)
Reading/Language Arts Proficiency
Highest reading/language arts proficiency (Top 1%)
Science Proficiency
Highest science proficiency (Top 5%)
Graduation Rate
Highest graduation rate (Top 10%)
Diversity
Most diverse schools (Top 1%)
Community Size
Largest student body (number of students) (Top 1%)
For the 2025 school year, there are 14 public elementary schools serving 6,266 students in BASIS Texas School District.
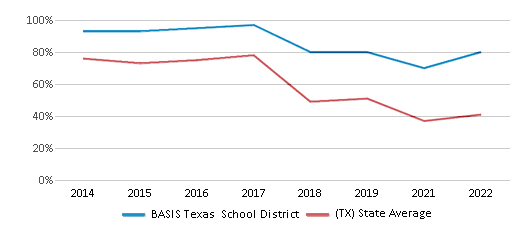
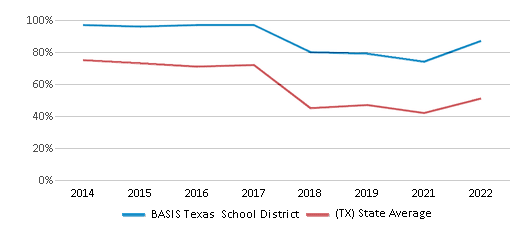
Public Elementary Schools in BASIS Texas School District have an average math proficiency score of 80% (versus the Texas public elementary school average of 42%), and reading proficiency score of 87% (versus the 52% statewide average).
Minority enrollment is 86% of the student body (majority Asian), which is more than the Texas public elementary school average of 75% (majority Hispanic).
Overview
This School District
This State (TX)
# Schools
14 Schools
6,902 Schools
# Students
6,266 Students
3,737,053 Students
# Teachers
380 Teachers
255,471 Teachers
Student : Teacher Ratio
16:1
16:1
District Rank
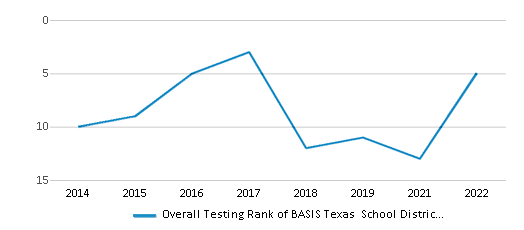
BASIS Texas School District, which is ranked #6 of all 1,196 school districts in Texas (based off of combined math and reading proficiency testing data) for the 2021-2022 school year.
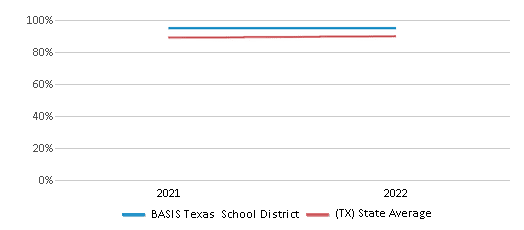
The school district's graduation rate of 95% has stayed relatively flat over five school years.
Overall District Rank
#5 out of 1204 school districts
(Top 1%)
(Top 1%)
Math Test Scores (% Proficient)
80%
41%
Reading/Language Arts Test Scores (% Proficient)
87%
51%
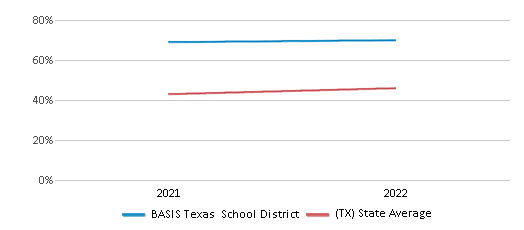
Science Test Scores (% Proficient)
70%
46%
Graduation Rate
≥95%
90%
Students by Ethnicity:
Diversity Score
0.68
0.64
# American Indian Students
49 Students
11,705 Students
% American Indian Students
1%
n/a
# Asian Students
3,097 Students
203,767 Students
% Asian Students
49%
6%
# Hispanic Students
1,444 Students
1,997,454 Students
% Hispanic Students
23%
53%
# Black Students
351 Students
469,194 Students
% Black Students
6%
13%
# White Students
887 Students
924,841 Students
% White Students
14%
25%
# Hawaiian Students
2 Students
5,879 Students
% Hawaiian Students
n/a
n/a
# Two or more races Students
436 Students
124,213 Students
% of Two or more races Students
7%
3%
Students by Grade:
# Students in PK Grade:
-
222,501
# Students in K Grade:
831
346,866
# Students in 1st Grade:
843
385,427
# Students in 2nd Grade:
732
402,148
# Students in 3rd Grade:
730
399,623
# Students in 4th Grade:
692
398,690
# Students in 5th Grade:
644
399,071
# Students in 6th Grade:
612
402,143
# Students in 7th Grade:
488
335,034
# Students in 8th Grade:
313
339,814
# Students in 9th Grade:
149
32,833
# Students in 10th Grade:
82
28,116
# Students in 11th Grade:
82
23,862
# Students in 12th Grade:
68
20,925
# Ungraded Students:
-
-
District Revenue and Spending
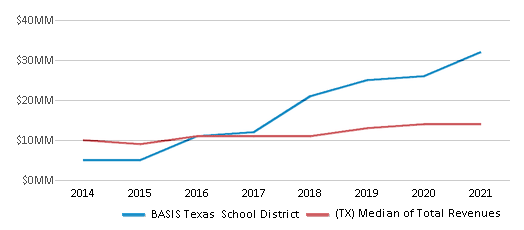
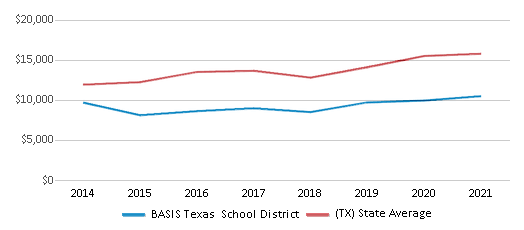
The revenue/student of $5,105 in this school district is less than the state median of $13,387. The school district revenue/student has declined by 51% over four school years.
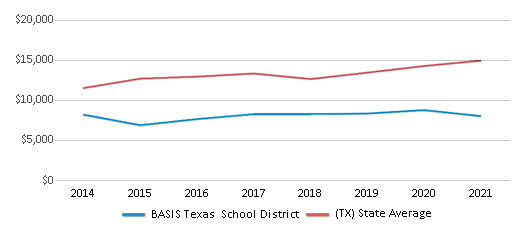
The school district's spending/student of $3,893 is less than the state median of $14,116. The school district spending/student has declined by 51% over four school years.
Total Revenue
$32 MM
$74,029 MM
Spending
$24 MM
$78,063 MM

Revenue / Student
$5,105
$13,387
Spending / Student
$3,893
$14,116
Best BASIS Texas School District Public Elementary Schools (2025)
School
(Math and Reading Proficiency)
(Math and Reading Proficiency)
Location
Grades
Students
Rank: #11.
Basis Austin
Charter School
(Math: 89% | Reading: 92%)
Rank:
Rank:
10/
Top 1%10
1605 Kramer Ln
Austin, TX 78758
(737) 263-5890
Austin, TX 78758
(737) 263-5890
Grades: 3-8
| 211 students
Rank: #22.
Basis San Antonio- Shavano Campus
Charter School
(Math: 84% | Reading: 90%)
Rank:
Rank:
10/
Top 1%10
4114 Lockhill Selma Rd
San Antonio, TX 78216
(210) 874-9250
San Antonio, TX 78216
(210) 874-9250
Grades: 6-12
| 1,038 students
Rank: #33.
Basis San Antonio Pri- Medical Center Campus
Charter School
(Math: 80% | Reading: 85%)
Rank:
Rank:
10/
Top 5%10
8519 Floyd Curl Dr
San Antonio, TX 78216
(210) 319-5525
San Antonio, TX 78216
(210) 319-5525
Grades: K-5
| 771 students
Rank: #44.
Basis Austin Primary
Charter School
(Math: 70-74% | Reading: 70-74% )
Rank:
Rank:
10/
Top 5%10
1605 Kramer Ln
Austin, TX 78758
(737) 263-5890
Austin, TX 78758
(737) 263-5890
Grades: K-2
| 201 students
Rank: #55.
Basis San Antonio- Pri North Central Campus
Charter School
(Math: 67% | Reading: 85%)
Rank:
Rank:
10/
Top 5%10
318 E Ramsey Rd
San Antonio, TX 78216
(210) 775-4125
San Antonio, TX 78216
(210) 775-4125
Grades: K-5
| 735 students
Rank: #66.
Basis San Antonio - Northeast Campus
Charter School
(Math: 70-79% | Reading: 70-79%)
Rank:
Rank:
10/
Top 10%10
11542 Wayland Way
San Antonio, TX 78233
(210) 289-2088
San Antonio, TX 78233
(210) 289-2088
Grades: 5-8
| 138 students
Rank: #77.
Basis San Antonio Pri - Northeast Campus
Charter School
(Math: 65-69% | Reading: 75-79%)
Rank:
Rank:
10/
Top 10%10
11550 I 35 Frontage Rd
San Antonio, TX 78233
(210) 742-6310
San Antonio, TX 78233
(210) 742-6310
Grades: K-4
| 282 students
Rank: n/an/a
Basis Benbrook
Charter School
8901 Vista Way
Fort Worth, TX 76126
(210) 981-1071
Fort Worth, TX 76126
(210) 981-1071
Grades: K-6
| 459 students
Rank: n/an/a
Basis Cedar Park
Charter School
165 N Lakeline Blvd
Cedar Park, TX 78613
(210) 981-1071
Cedar Park, TX 78613
(210) 981-1071
Grades: 6-9
| 279 students
Rank: n/an/a
Basis Cedar Park Primary
Charter School
165 N Lakeline Blvd
Cedar Park, TX 78613
(210) 981-1071
Cedar Park, TX 78613
(210) 981-1071
Grades: K-5
| 718 students
Rank: n/an/a
Basis Pflugerville
Charter School
1217 S 10th St
Pflugerville, TX 78660
(210) 981-1071
Pflugerville, TX 78660
(210) 981-1071
Grades: 6-9
| 170 students
Rank: n/an/a
Basis Pflugerville Primary
Charter School
1217 S 10th St
Pflugerville, TX 78660
(210) 981-1071
Pflugerville, TX 78660
(210) 981-1071
Grades: K-5
| 618 students
Rank: n/an/a
Basis San Antonio - Jack Lewis Jr Campus
Charter School
3303 N Ellison Dr
San Antonio, TX 78251
(480) 289-2088
San Antonio, TX 78251
(480) 289-2088
Grades: 6-7
| 132 students
Rank: n/an/a
Basis San Antonio Pri - Jack Lewis Jr Campus
Charter School
3303 N Ellison Dr
San Antonio, TX 78251
(210) 981-1071
San Antonio, TX 78251
(210) 981-1071
Grades: K-5
| 514 students
Recent Articles

What Is A Charter School?
Explore the world of charter schools in this comprehensive guide. Learn about their history, how they operate, and the pros and cons of this educational innovation. Discover key facts about charter schools, including admission policies, demographics, and funding, as well as what to look for when considering a charter school for your child.

10 Reasons Why High School Sports Benefit Students
Discover the 10 compelling reasons why high school sports are beneficial for students. This comprehensive article explores how athletics enhance academic performance, foster personal growth, and develop crucial life skills. From improved fitness and time management to leadership development and community representation, learn why participating in high school sports can be a game-changer for students' overall success and well-being.

February 05, 2025
Understanding the U.S. Department of Education: Structure, Impact, and EvolutionWe explore how the Department of Education shapes American education, from its cabinet-level leadership to its impact on millions of students, written for general audiences seeking clarity on this vital institution.


