Top Rankings
Bridgeway Preparatory Academy School District ranks among the top 20% of public school district in Texas for:
Category
Attribute
Diversity
Most diverse schools (Top 1%)
For the 2025 school year, there is 1 public school serving 125 students in Bridgeway Preparatory Academy School District. This district's average testing ranking is 2/10, which is in the bottom 50% of public schools in Texas.
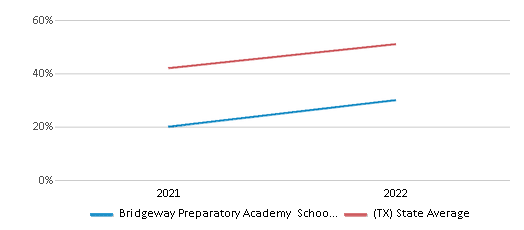
Public School in Bridgeway Preparatory Academy School District have an average math proficiency score of 30% (versus the Texas public school average of 41%), and reading proficiency score of 30% (versus the 51% statewide average).
Minority enrollment is 90% of the student body (majority Black and Hispanic), which is more than the Texas public school average of 75% (majority Hispanic).
Overview
This School District
This State (TX)
# Schools
1 School
9,320 Schools
# Students
125 Students
5,529,984 Students
# Teachers
6 Teachers
374,844 Teachers
Student : Teacher Ratio
21:1
21:1
District Rank
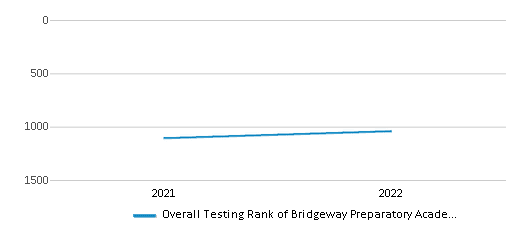
Bridgeway Preparatory Academy School District, which is ranked #1034 of all 1,196 school districts in Texas (based off of combined math and reading proficiency testing data) for the 2021-2022 school year.
Overall District Rank
#1041 out of 1204 school districts
(Bottom 50%)
(Bottom 50%)
Math Test Scores (% Proficient)
21-39%
41%
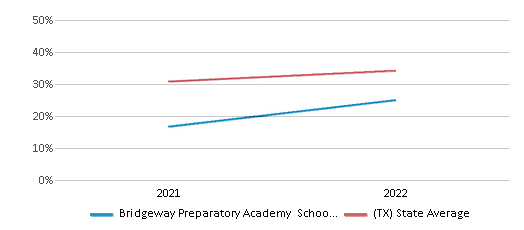
Reading/Language Arts Test Scores (% Proficient)
21-39%
51%
Science Test Scores (% Proficient)
<50%
46%
Students by Ethnicity:
Diversity Score
0.71
0.64
# American Indian Students
2 Students
17,916 Students
% American Indian Students
2%
n/a
# Asian Students
17 Students
296,049 Students
% Asian Students
14%
6%
# Hispanic Students
44 Students
2,942,422 Students
% Hispanic Students
35%
53%
# Black Students
48 Students
706,008 Students
% Black Students
38%
13%
# White Students
12 Students
1,384,941 Students
% White Students
9%
25%
# Hawaiian Students
n/a
8,841 Students
% Hawaiian Students
n/a
n/a
# Two or more races Students
2 Students
173,807 Students
% of Two or more races Students
2%
3%
Students by Grade:
# Students in PK Grade:
42
275,832
# Students in K Grade:
16
361,958
# Students in 1st Grade:
12
385,427
# Students in 2nd Grade:
16
402,148
# Students in 3rd Grade:
15
399,623
# Students in 4th Grade:
11
398,690
# Students in 5th Grade:
8
399,071
# Students in 6th Grade:
5
402,143
# Students in 7th Grade:
-
406,424
# Students in 8th Grade:
-
414,179
# Students in 9th Grade:
-
472,263
# Students in 10th Grade:
-
438,622
# Students in 11th Grade:
-
406,207
# Students in 12th Grade:
-
367,397
# Ungraded Students:
-
-
District Revenue and Spending
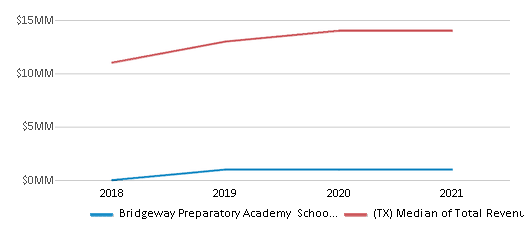
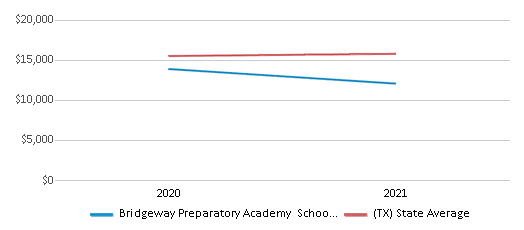
The revenue/student of $9,760 in this school district is less than the state median of $13,387. The school district revenue/student has declined by 19% over four school years.
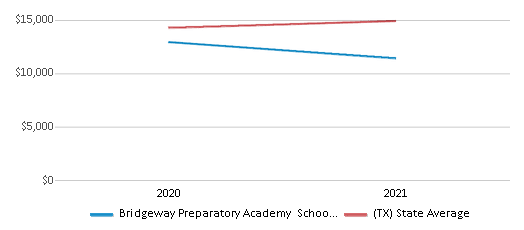
The school district's spending/student of $9,224 is less than the state median of $14,116. The school district spending/student has declined by 19% over four school years.
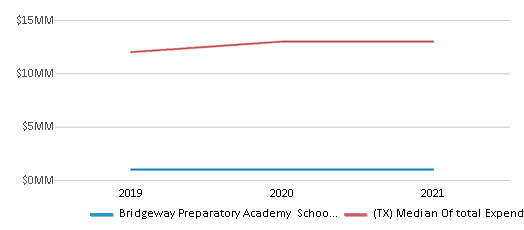
Total Revenue
$1 MM
$74,029 MM
Spending
$1 MM
$78,063 MM
Revenue / Student
$9,760
$13,387
Spending / Student
$9,224
$14,116
Best Bridgeway Preparatory Academy School District Public Schools (2025)
School
(Math and Reading Proficiency)
(Math and Reading Proficiency)
Location
Grades
Students
Rank: #11.
Bridgeway Preparatory Academy
Charter School
(Math: 21-39% | Reading: 21-39%)
Rank:
Rank:
2/
Bottom 50%10
18106 Marsh Ln
Dallas, TX 75287
(214) 257-8883
Dallas, TX 75287
(214) 257-8883
Grades: PK-6
| 125 students
Frequently Asked Questions
How many schools belong to Bridgeway Preparatory Academy School District?
Bridgeway Preparatory Academy School District manages 1 public schools serving 125 students.
What is the rank of Bridgeway Preparatory Academy School District?
Bridgeway Preparatory Academy School District is ranked #1034 out of 1,196 school districts in Texas (bottom 50%) based off of combined math and reading proficiency testing data for the 2021-2022 school year. This district ranks in the top 20% of Texas school districts for: Most diverse schools (Top 1%)
What is the racial composition of students in Bridgeway Preparatory Academy School District?
38% of Bridgeway Preparatory Academy School District students are Black, 35% of students are Hispanic, 14% of students are Asian, 9% of students are White, 2% of students are American Indian, and 2% of students are Two or more races.
What is the student/teacher ratio of Bridgeway Preparatory Academy School District?
Bridgeway Preparatory Academy School District has a student/teacher ratio of 21:1, which is higher than the Texas state average of 15:1.
What is Bridgeway Preparatory Academy School District's spending/student ratio?
The school district's spending/student of $9,224 is less than the state median of $14,116. The school district spending/student has declined by 19% over four school years.
Recent Articles

Year-Round Or Traditional Schedule?
Which is more appropriate for your child? A year-round attendance schedule or traditional schedule? We look at the pros and cons.

Why You Should Encourage Your Child to Join a Sports Team
Participating in team sports has a great many benefits for children, there is no doubt. In this article you will learn what those benefits are.

White Students are Now the Minority in U.S. Public Schools
Increasing birth rates among immigrant families from Asia and Central and South America, combined with lower birth rates among white families, means that for the first time in history, public school students in the United States are majority-minority. This shift in demographics poses difficulties for schools as they work to accommodate children of varying language abilities and socio-economic backgrounds.


