Top Rankings
Houston Independent School District ranks among the top 20% of public school district in Texas for:
Category
Attribute
Community Size
Largest student body (number of students) (Top 1%)
For the 2025 school year, there are 175 public preschools serving 91,391 students in Houston Independent School District. This district's average pre testing ranking is 5/10, which is in the bottom 50% of public pre schools in Texas.
Public Preschools in Houston Independent School District have an average math proficiency score of 42% (versus the Texas public pre school average of 43%), and reading proficiency score of 49% (versus the 53% statewide average).
Minority enrollment is 90% of the student body (majority Hispanic), which is more than the Texas public preschool average of 76% (majority Hispanic).
Overview
This School District
This State (TX)
# Schools
275 Schools
4,192 Schools
# Students
184,109 Students
2,151,418 Students
# Teachers
11,796 Teachers
147,942 Teachers
Student : Teacher Ratio
16:1
16:1
District Rank
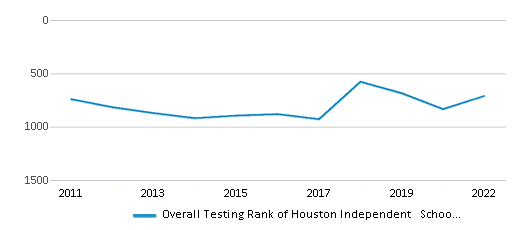
Houston Independent School District, which is ranked #706 of all 1,196 school districts in Texas (based off of combined math and reading proficiency testing data) for the 2021-2022 school year.
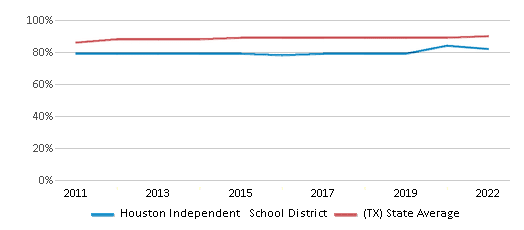
The school district's graduation rate of 82% has increased from 78% over five school years.
Overall District Rank
#710 out of 1204 school districts
(Bottom 50%)
(Bottom 50%)
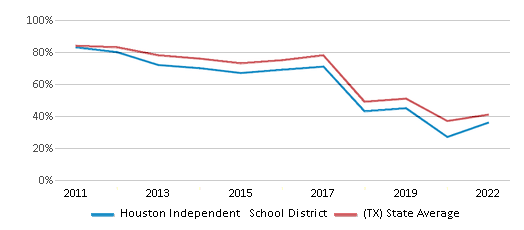
Math Test Scores (% Proficient)
36%
41%
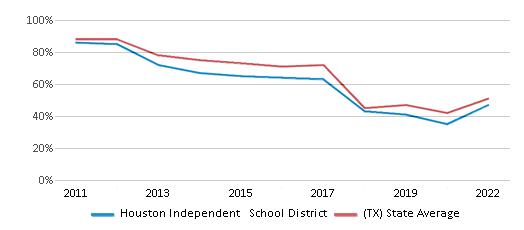
Reading/Language Arts Test Scores (% Proficient)
47%
51%
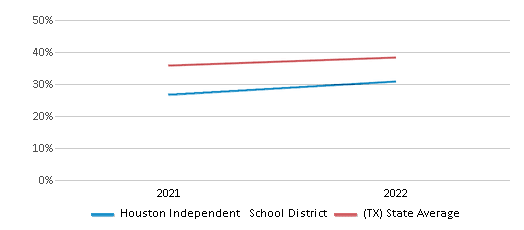
Science Test Scores (% Proficient)
37%
46%
Graduation Rate
82%
90%
Students by Ethnicity:
Diversity Score
0.57
0.63
# American Indian Students
325 Students
6,302 Students
% American Indian Students
n/a
n/a
# Asian Students
9,162 Students
104,203 Students
% Asian Students
5%
5%
# Hispanic Students
113,651 Students
1,180,208 Students
% Hispanic Students
62%
55%
# Black Students
39,247 Students
275,255 Students
% Black Students
21%
13%
# White Students
18,199 Students
509,082 Students
% White Students
10%
24%
# Hawaiian Students
133 Students
3,291 Students
% Hawaiian Students
n/a
n/a
# Two or more races Students
3,392 Students
73,077 Students
% of Two or more races Students
2%
3%
Students by Grade:
# Students in PK Grade:
12,416
275,832
# Students in K Grade:
12,672
307,607
# Students in 1st Grade:
14,166
310,480
# Students in 2nd Grade:
14,610
317,113
# Students in 3rd Grade:
14,104
300,451
# Students in 4th Grade:
13,842
295,281
# Students in 5th Grade:
14,046
258,890
# Students in 6th Grade:
11,311
33,806
# Students in 7th Grade:
11,646
14,241
# Students in 8th Grade:
12,387
12,959
# Students in 9th Grade:
15,751
7,002
# Students in 10th Grade:
13,234
6,366
# Students in 11th Grade:
12,706
5,781
# Students in 12th Grade:
11,218
5,609
# Ungraded Students:
-
-
District Revenue and Spending
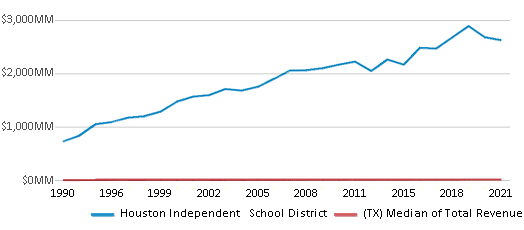
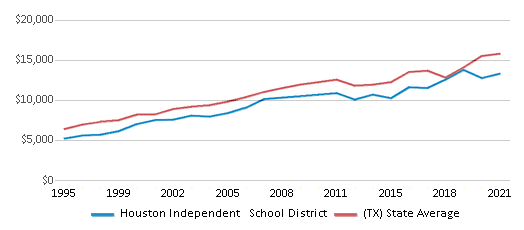
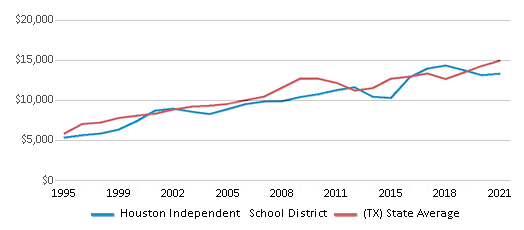
The revenue/student of $14,244 is higher than the state median of $13,387. The school district revenue/student has grown by 6% over four school years.
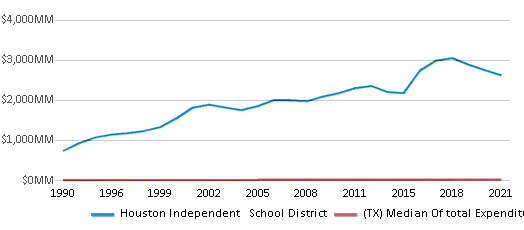
The school district's spending/student of $14,231 is higher than the state median of $14,116. The school district spending/student has grown by 6% over four school years.
Total Revenue
$2,622 MM
$74,029 MM
Spending
$2,620 MM
$78,063 MM
Revenue / Student
$14,244
$13,387
Spending / Student
$14,231
$14,116
Best Houston Independent School District Public Preschools (2025)
School
(Math and Reading Proficiency)
(Math and Reading Proficiency)
Location
Grades
Students
Rank: #11.
West University Elementary School
(Math: 87% | Reading: 90%)
Rank:
Rank:
10/
Top 1%10
3756 University Blvd
Houston, TX 77005
(713) 295-5215
Houston, TX 77005
(713) 295-5215
Grades: PK-5
| 1,131 students
Rank: #22.
River Oaks Elementary School
Magnet School
(Math: 85% | Reading: 89%)
Rank:
Rank:
10/
Top 1%10
2008 Kirby Dr
Houston, TX 77019
(713) 942-1460
Houston, TX 77019
(713) 942-1460
Grades: PK-5
| 744 students
Rank: #33.
Roberts Elementary School
(Math: 82% | Reading: 88%)
Rank:
Rank:
10/
Top 1%10
6000 Greenbriar St
Houston, TX 77030
(713) 295-5272
Houston, TX 77030
(713) 295-5272
Grades: PK-5
| 730 students
Rank: #4 - 54. - 5.
Horn Elementary School
(Math: 85% | Reading: 85%)
Rank:
Rank:
10/
Top 1%10
4530 Holly St
Bellaire, TX 77401
(713) 295-5264
Bellaire, TX 77401
(713) 295-5264
Grades: PK-5
| 753 students
Rank: #4 - 54. - 5.
Mandarin Immersion Magnet School
Magnet School
(Math: 85% | Reading: 85%)
Rank:
Rank:
10/
Top 1%10
5445 W Alabama
Houston, TX 77056
(713) 295-5276
Houston, TX 77056
(713) 295-5276
Grades: PK-8
| 792 students
Rank: #66.
Field Elementary School
(Math: 75-79% | Reading: 80-84%)
Rank:
Rank:
10/
Top 5%10
703 E 17th St
Houston, TX 77008
(713) 867-5190
Houston, TX 77008
(713) 867-5190
Grades: PK-5
| 464 students
Rank: #77.
Bush Elementary School
(Math: 79% | Reading: 81%)
Rank:
Rank:
10/
Top 5%10
13800 Westerloch Dr
Houston, TX 77077
(281) 368-2150
Houston, TX 77077
(281) 368-2150
Grades: PK-5
| 726 students
Rank: #88.
Twain Elementary School
(Math: 72% | Reading: 82%)
Rank:
Rank:
10/
Top 5%10
7500 Braes Blvd
Houston, TX 77025
(713) 295-5230
Houston, TX 77025
(713) 295-5230
Grades: PK-5
| 870 students
Rank: #99.
Travis Elementary School
Magnet School
(Math: 73% | Reading: 81%)
Rank:
Rank:
10/
Top 5%10
3311 Beauchamp St
Houston, TX 77009
(713) 802-4790
Houston, TX 77009
(713) 802-4790
Grades: PK-5
| 725 students
Rank: #1010.
Kolter Elementary School
Magnet School
(Math: 71% | Reading: 82%)
Rank:
Rank:
10/
Top 5%10
6300 Ave B
Houston, TX 77096
(713) 726-3630
Houston, TX 77096
(713) 726-3630
Grades: PK-5
| 762 students
Rank: #1111.
Oak Forest Elementary School
Magnet School
(Math: 71% | Reading: 81%)
Rank:
Rank:
10/
Top 5%10
1401 W 43rd St
Houston, TX 77018
(713) 613-2536
Houston, TX 77018
(713) 613-2536
Grades: PK-5
| 922 students
Rank: #1212.
Harvard Elementary School
Magnet School
(Math: 67% | Reading: 80%)
Rank:
Rank:
10/
Top 10%10
810 Harvard St
Houston, TX 77007
(713) 867-5210
Houston, TX 77007
(713) 867-5210
Grades: PK-5
| 673 students
Rank: #1313.
Briarmeadow Charter
Charter School
(Math: 69% | Reading: 74%)
Rank:
Rank:
10/
Top 10%10
3601 Dunvale
Houston, TX 77063
(713) 458-5500
Houston, TX 77063
(713) 458-5500
Grades: PK-8
| 580 students
Rank: #1414.
Condit Elementary School
(Math: 64% | Reading: 77%)
Rank:
Rank:
10/
Top 10%10
7000 S Third
Bellaire, TX 77401
(713) 295-5255
Bellaire, TX 77401
(713) 295-5255
Grades: PK-5
| 733 students
Rank: #1515.
Lovett Elementary School
Magnet School
(Math: 66% | Reading: 73%)
Rank:
Rank:
10/
Top 10%10
8814 S Rice Ave
Houston, TX 77096
(713) 295-5258
Houston, TX 77096
(713) 295-5258
Grades: PK-5
| 654 students
Rank: #1616.
Sinclair Elementary School
Magnet School
(Math: 63% | Reading: 70%)
Rank:
Rank:
9/
Top 20%10
6410 Grovewood Ln
Houston, TX 77008
(713) 867-5161
Houston, TX 77008
(713) 867-5161
Grades: PK-5
| 716 students
Rank: #1717.
Wharton K-8 Dual Language Academy
Magnet School
(Math: 69% | Reading: 65%)
Rank:
Rank:
9/
Top 20%10
900 W Gray St
Houston, TX 77019
(713) 535-3771
Houston, TX 77019
(713) 535-3771
Grades: PK-8
| 651 students
Rank: #1818.
Parker Elementary School
Magnet School
(Math: 63% | Reading: 68%)
Rank:
Rank:
9/
Top 20%10
10626 Atwell Dr
Houston, TX 77096
(713) 726-3634
Houston, TX 77096
(713) 726-3634
Grades: PK-5
| 887 students
Rank: #1919.
School At St George Place
(Math: 59% | Reading: 68%)
Rank:
Rank:
9/
Top 20%10
5430 Hidalgo St
Houston, TX 77056
(713) 625-1499
Houston, TX 77056
(713) 625-1499
Grades: PK-5
| 784 students
Rank: #2020.
Davila Elementary School
Magnet School
(Math: 65-69% | Reading: 60-64%)
Rank:
Rank:
9/
Top 20%10
7610 Dahlia St
Houston, TX 77012
(713) 924-1851
Houston, TX 77012
(713) 924-1851
Grades: PK-5
| 416 students
Rank: #2121.
Ella J Baker Montessori School
Magnet School
(Math: 55% | Reading: 71%)
Rank:
Rank:
9/
Top 20%10
2100 Yupon St
Houston, TX 77006
(713) 942-1470
Houston, TX 77006
(713) 942-1470
Grades: PK-8
| 617 students
Rank: #2222.
Poe Elementary School
Magnet School
(Math: 56% | Reading: 68%)
Rank:
Rank:
9/
Top 20%10
5100 Hazard St
Houston, TX 77098
(713) 535-3780
Houston, TX 77098
(713) 535-3780
Grades: PK-5
| 736 students
Rank: #23 - 2423. - 24.
Arabic Immersion Magnet School
Magnet School
(Math: 60-64% | Reading: 60-64%)
Rank:
Rank:
9/
Top 20%10
4001 Stanford St
Houston, TX 77006
(713) 556-8940
Houston, TX 77006
(713) 556-8940
Grades: PK-8
| 611 students
Rank: #23 - 2423. - 24.
Memorial Elementary School
(Math: 60-64% | Reading: 60-64%)
Rank:
Rank:
9/
Top 20%10
6401 Arnot St
Houston, TX 77007
(713) 867-5150
Houston, TX 77007
(713) 867-5150
Grades: PK-5
| 447 students
Rank: #2525.
Helms Elementary School
Magnet School
(Math: 55-59% | Reading: 60-64%)
Rank:
Rank:
9/
Top 20%10
503 W 21st St
Houston, TX 77008
(713) 867-5130
Houston, TX 77008
(713) 867-5130
Grades: PK-5
| 481 students
Rank: #2626.
Red Elementary School
Magnet School
(Math: 52% | Reading: 67%)
Rank:
Rank:
9/
Top 20%10
4520 Tonawanda Dr
Houston, TX 77035
(713) 726-3638
Houston, TX 77035
(713) 726-3638
Grades: PK-5
| 586 students
Rank: #2727.
Windsor Village Elementary School
Magnet School
(Math: 60% | Reading: 59%)
Rank:
Rank:
9/
Top 20%10
14440 Polo St
Houston, TX 77085
(713) 726-3642
Houston, TX 77085
(713) 726-3642
Grades: PK-5
| 638 students
Rank: #2828.
Brookline Elementary School
(Math: 55% | Reading: 62%)
Rank:
Rank:
8/
Top 30%10
6301 S Loop E
Houston, TX 77087
(713) 845-7400
Houston, TX 77087
(713) 845-7400
Grades: PK-5
| 663 students
Rank: #29 - 3029. - 30.
Foster Elementary School
(Math: 50-54% | Reading: 55-59%)
Rank:
Rank:
8/
Top 30%10
3919 Ward St
Houston, TX 77021
(713) 746-8260
Houston, TX 77021
(713) 746-8260
Grades: PK-5
| 363 students
Rank: #29 - 3029. - 30.
Love Elementary School
(Math: 50-54% | Reading: 55-59%)
Rank:
Rank:
8/
Top 30%10
1120 W 13th St
Houston, TX 77008
(713) 867-0840
Houston, TX 77008
(713) 867-0840
Grades: PK-5
| 345 students
Rank: #3131.
Deanda Elementary School
(Math: 49% | Reading: 57%)
Rank:
Rank:
8/
Top 30%10
7980 Almeda Genoa Rd
Houston, TX 77075
(713) 556-9550
Houston, TX 77075
(713) 556-9550
Grades: PK-5
| 641 students
Rank: #3232.
Cornelius Elementary School
Magnet School
(Math: 55% | Reading: 52%)
Rank:
Rank:
8/
Top 30%10
7475 Westover St
Houston, TX 77087
(713) 845-7405
Houston, TX 77087
(713) 845-7405
Grades: PK-5
| 753 students
Rank: #3333.
Moreno Elementary School
(Math: 52% | Reading: 53%)
Rank:
Rank:
8/
Top 30%10
620 E Canino
Houston, TX 77037
(281) 405-2150
Houston, TX 77037
(281) 405-2150
Grades: PK-6
| 692 students
Rank: #3434.
Herod Elementary School
Magnet School
(Math: 46% | Reading: 60%)
Rank:
Rank:
8/
Top 30%10
5627 Jason St
Houston, TX 77096
(713) 778-3315
Houston, TX 77096
(713) 778-3315
Grades: PK-5
| 766 students
Rank: #3535.
Pugh Elementary School
Magnet School
(Math: 50-54% | Reading: 50-54%)
Rank:
Rank:
7/
Top 50%10
1147 Kress St
Houston, TX 77020
(713) 671-3820
Houston, TX 77020
(713) 671-3820
Grades: PK-5
| 320 students
Show 100 more public schools in Houston Independent School District (out of 175 total schools)
Loading...
Recent Articles

What Is A Charter School?
Explore the world of charter schools in this comprehensive guide. Learn about their history, how they operate, and the pros and cons of this educational innovation. Discover key facts about charter schools, including admission policies, demographics, and funding, as well as what to look for when considering a charter school for your child.

10 Reasons Why High School Sports Benefit Students
Discover the 10 compelling reasons why high school sports are beneficial for students. This comprehensive article explores how athletics enhance academic performance, foster personal growth, and develop crucial life skills. From improved fitness and time management to leadership development and community representation, learn why participating in high school sports can be a game-changer for students' overall success and well-being.

February 05, 2025
Understanding the U.S. Department of Education: Structure, Impact, and EvolutionWe explore how the Department of Education shapes American education, from its cabinet-level leadership to its impact on millions of students, written for general audiences seeking clarity on this vital institution.


