Top Rankings
Judson Independent School District ranks among the top 20% of public school district in Texas for:
Category
Attribute
Community Size
Largest student body (number of students) (Top 1%)
For the 2025 school year, there are 27 public elementary schools serving 16,894 students in Judson Independent School District. This district's average elementary testing ranking is 3/10, which is in the bottom 50% of public elementary schools in Texas.
Public Elementary Schools in Judson Independent School District have an average math proficiency score of 29% (versus the Texas public elementary school average of 42%), and reading proficiency score of 46% (versus the 52% statewide average).
Minority enrollment is 88% of the student body (majority Hispanic), which is more than the Texas public elementary school average of 75% (majority Hispanic).
Overview
This School District
This State (TX)
# Schools
34 Schools
6,902 Schools
# Students
23,848 Students
3,737,053 Students
# Teachers
1,643 Teachers
255,471 Teachers
Student : Teacher Ratio
15:1
15:1
District Rank
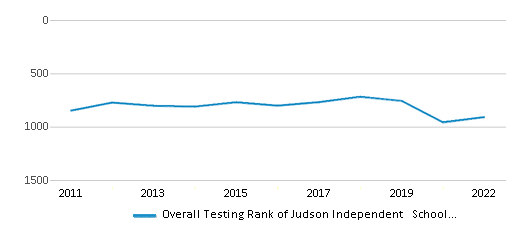
Judson Independent School District, which is ranked #908 of all 1,196 school districts in Texas (based off of combined math and reading proficiency testing data) for the 2021-2022 school year.
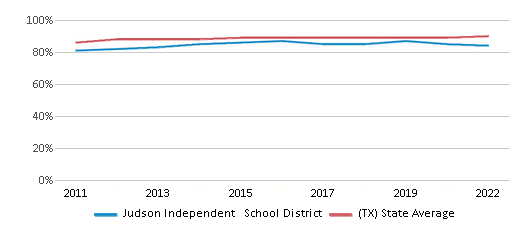
The school district's graduation rate of 84% has decreased from 87% over five school years.
Overall District Rank
#908 out of 1204 school districts
(Bottom 50%)
(Bottom 50%)
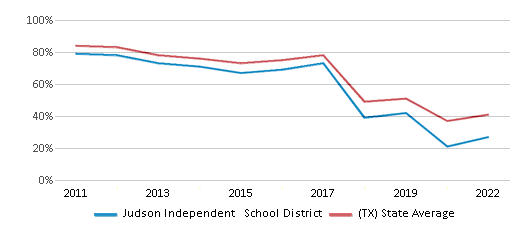
Math Test Scores (% Proficient)
27%
41%
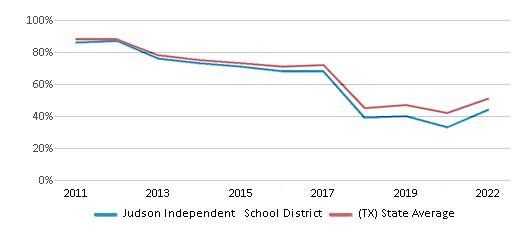
Reading/Language Arts Test Scores (% Proficient)
44%
51%
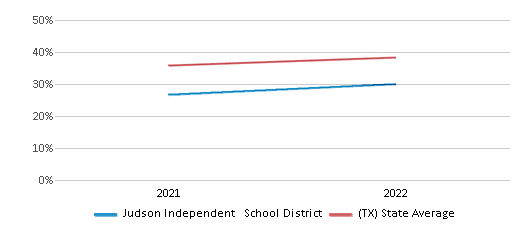
Science Test Scores (% Proficient)
36%
46%
Graduation Rate
84%
90%
Students by Ethnicity:
Diversity Score
0.59
0.64
# American Indian Students
48 Students
11,705 Students
% American Indian Students
n/a
n/a
# Asian Students
431 Students
203,767 Students
% Asian Students
2%
6%
# Hispanic Students
14,112 Students
1,997,454 Students
% Hispanic Students
59%
53%
# Black Students
5,140 Students
469,194 Students
% Black Students
22%
13%
# White Students
2,933 Students
924,841 Students
% White Students
12%
25%
# Hawaiian Students
107 Students
5,879 Students
% Hawaiian Students
n/a
n/a
# Two or more races Students
1,077 Students
124,213 Students
% of Two or more races Students
5%
3%
Students by Grade:
# Students in PK Grade:
1,646
222,501
# Students in K Grade:
1,654
346,866
# Students in 1st Grade:
1,818
385,427
# Students in 2nd Grade:
1,830
402,148
# Students in 3rd Grade:
1,757
399,623
# Students in 4th Grade:
1,764
398,690
# Students in 5th Grade:
1,658
399,071
# Students in 6th Grade:
1,590
402,143
# Students in 7th Grade:
1,548
335,034
# Students in 8th Grade:
1,561
339,814
# Students in 9th Grade:
1,877
32,833
# Students in 10th Grade:
1,775
28,116
# Students in 11th Grade:
1,839
23,862
# Students in 12th Grade:
1,531
20,925
# Ungraded Students:
-
-
District Revenue and Spending
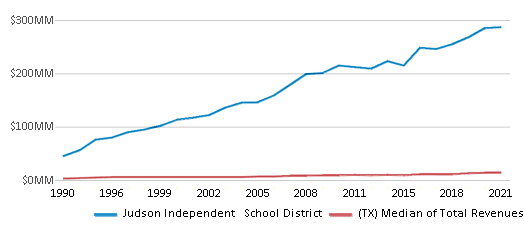
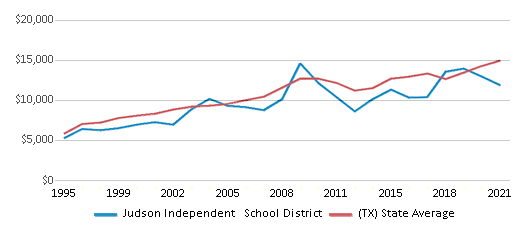
The revenue/student of $12,019 in this school district is less than the state median of $13,387. The school district revenue/student has stayed relatively flat over four school years.
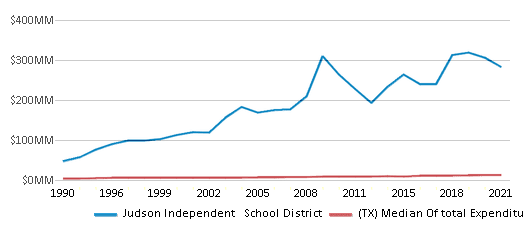
The school district's spending/student of $11,847 is less than the state median of $14,116. The school district spending/student has stayed relatively flat over four school years.
Total Revenue
$287 MM
$74,029 MM
Spending
$283 MM
$78,063 MM
Revenue / Student
$12,019
$13,387
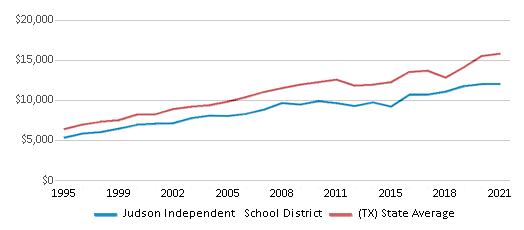
Spending / Student
$11,847
$14,116
Best Judson Independent School District Public Elementary Schools (2025)
School
(Math and Reading Proficiency)
(Math and Reading Proficiency)
Location
Grades
Students
Rank: #11.
Wortham Oaks Elementary School
(Math: 64% | Reading: 78%)
Rank:
Rank:
10/
Top 10%10
5710 Carriage Cape
San Antonio, TX 78261
(210) 945-5750
San Antonio, TX 78261
(210) 945-5750
Grades: PK-6
| 723 students
Rank: #22.
Crestview Elementary School
(Math: 62% | Reading: 72%)
Rank:
Rank:
10/
Top 10%10
7710 Narrow Pass
San Antonio, TX 78233
(210) 656-5900
San Antonio, TX 78233
(210) 656-5900
Grades: PK-5
| 594 students
Rank: #33.
Olympia Elementary School
(Math: 40-44% | Reading: 60-64%)
Rank:
Rank:
7/
Top 50%10
8439 Athenian
Universal City, TX 78148
(210) 945-5113
Universal City, TX 78148
(210) 945-5113
Grades: PK-5
| 461 students
Rank: #44.
Ricardo Salinas Elementary School
(Math: 47% | Reading: 56%)
Rank:
Rank:
7/
Top 50%10
10560 Old Cimmaron Trl
Universal City, TX 78148
(210) 659-5045
Universal City, TX 78148
(210) 659-5045
Grades: PK-5
| 694 students
Rank: #55.
Rolling Meadows Elementary School
(Math: 36% | Reading: 56%)
Rank:
Rank:
6/
Top 50%10
17222 Fm 2252
San Antonio, TX 78233
(210) 945-5700
San Antonio, TX 78233
(210) 945-5700
Grades: PK-5
| 691 students
Rank: #66.
Elolf Elementary School
(Math: 40% | Reading: 50%)
Rank:
Rank:
6/
Top 50%10
6335 Beech Trl
Converse, TX 78109
(210) 661-1130
Converse, TX 78109
(210) 661-1130
Grades: PK-5
| 600 students
Rank: #77.
Coronado Village Elementary School
(Math: 25-29% | Reading: 55-59%)
Rank:
Rank:
5/
Bottom 50%10
213 Amistad Blvd
Universal City, TX 78148
(210) 945-5110
Universal City, TX 78148
(210) 945-5110
Grades: PK-5
| 366 students
Rank: #88.
Copperfield Elementary School
(Math: 33% | Reading: 51%)
Rank:
Rank:
5/
Bottom 50%10
7595 E Loop 1604 N
Converse, TX 78109
(210) 619-0460
Converse, TX 78109
(210) 619-0460
Grades: PK-5
| 763 students
Rank: #99.
Miller Point Elementary School
(Math: 31% | Reading: 52%)
Rank:
Rank:
5/
Bottom 50%10
7027 Misty Rdg
Converse, TX 78109
(210) 590-3110
Converse, TX 78109
(210) 590-3110
Grades: PK-5
| 570 students
Rank: #1010.
Kitty Hawk Middle School
(Math: 36% | Reading: 48%)
Rank:
Rank:
5/
Bottom 50%10
840 Old Cimmaron Trl
Universal City, TX 78148
(210) 945-1220
Universal City, TX 78148
(210) 945-1220
Grades: 6-8
| 1,154 students
Rank: #1111.
Escondido Elementary School
(Math: 34% | Reading: 48%)
Rank:
Rank:
5/
Bottom 50%10
5000 Texas Palm
Converse, TX 78109
(210) 945-5100
Converse, TX 78109
(210) 945-5100
Grades: PK-5
| 785 students
Rank: #1212.
Education Franz Elementary School
(Math: 30-34% | Reading: 45-49%)
Rank:
Rank:
5/
Bottom 50%10
12301 Welcome Dr
San Antonio, TX 78233
(210) 945-5640
San Antonio, TX 78233
(210) 945-5640
Grades: PK-5
| 372 students
Rank: #1313.
Judson Middle School
(Math: 27% | Reading: 50%)
Rank:
Rank:
4/
Bottom 50%10
9695 Schaefer Rd
Converse, TX 78109
(210) 357-0801
Converse, TX 78109
(210) 357-0801
Grades: 6-8
| 1,207 students
Rank: #1414.
Mary Lou Hartman
(Math: 30% | Reading: 47%)
Rank:
Rank:
4/
Bottom 50%10
7203 Woodlake Pkwy
San Antonio, TX 78218
(210) 590-3080
San Antonio, TX 78218
(210) 590-3080
Grades: PK-5
| 656 students
Rank: #1515.
James L Masters
(Math: 27% | Reading: 44%)
Rank:
Rank:
3/
Bottom 50%10
2650 Woodlake Pkwy
Converse, TX 78109
(210) 945-1150
Converse, TX 78109
(210) 945-1150
Grades: PK-5
| 653 students
Rank: #1616.
Spring Meadows Elementary School
(Math: 22% | Reading: 46%)
Rank:
Rank:
3/
Bottom 50%10
7135 Elm Trl
San Antonio, TX 78244
(210) 662-1050
San Antonio, TX 78244
(210) 662-1050
Grades: PK-5
| 679 students
Rank: #1717.
Woodlake Elementary School
(Math: 29% | Reading: 40%)
Rank:
Rank:
3/
Bottom 50%10
5501 Lk Bend E
San Antonio, TX 78244
(210) 945-3920
San Antonio, TX 78244
(210) 945-3920
Grades: PK-5
| 686 students
Rank: #1818.
Hopkins Elementary School
(Math: 30% | Reading: 34%)
Rank:
Rank:
2/
Bottom 50%10
2440 Ackerman Rd
San Antonio, TX 78219
(210) 661-1120
San Antonio, TX 78219
(210) 661-1120
Grades: PK-5
| 764 students
Rank: #1919.
William Paschall Elementary School
(Math: 23% | Reading: 37%)
Rank:
Rank:
2/
Bottom 50%10
6351 Lakeview Dr
San Antonio, TX 78244
(210) 666-4113
San Antonio, TX 78244
(210) 666-4113
Grades: PK-5
| 706 students
Rank: #2020.
Converse Elementary School
(Math: 21% | Reading: 39%)
Rank:
Rank:
2/
Bottom 50%10
6720 Fm 1516
Converse, TX 78109
(210) 945-1210
Converse, TX 78109
(210) 945-1210
Grades: PK-5
| 508 students
Rank: #2121.
Henry Metzger Middle School
(Math: 18% | Reading: 40%)
Rank:
Rank:
2/
Bottom 50%10
7475 Binz Engleman Rd
San Antonio, TX 78244
(210) 662-2210
San Antonio, TX 78244
(210) 662-2210
Grades: 6-8
| 907 students
Rank: #2222.
Woodlake Hills Middle School
(Math: 21% | Reading: 37%)
Rank:
Rank:
2/
Bottom 50%10
6625 Woodlake Pkwy
San Antonio, TX 78244
(210) 661-1110
San Antonio, TX 78244
(210) 661-1110
Grades: 6-8
| 749 students
Rank: #2323.
Kirby Middle School
(Math: 18% | Reading: 36%)
Rank:
Rank:
2/
Bottom 50%10
5441 Seguin Rd
San Antonio, TX 78219
(210) 661-1140
San Antonio, TX 78219
(210) 661-1140
Grades: 6-8
| 637 students
Rank: #2424.
Park Village Elementary School
(Math: 15-19% | Reading: 30-34%)
Rank:
Rank:
1/
Bottom 50%10
5855 E Midcrown Dr
San Antonio, TX 78218
(210) 637-4890
San Antonio, TX 78218
(210) 637-4890
Grades: PK-5
| 401 students
Rank: #2525.
Candlewood Elementary School
(Math: 12% | Reading: 31%)
Rank:
Rank:
1/
Bottom 50%10
3635 Candleglen
San Antonio, TX 78244
(210) 662-1060
San Antonio, TX 78244
(210) 662-1060
Grades: PK-5
| 470 students
Rank: #2626.
Judson Care Academy
Alternative School
(Math: ≤5% | Reading: 10-14%)
Rank:
Rank:
1/
Bottom 50%10
102 School St
Converse, TX 78109
(210) 945-6730
Converse, TX 78109
(210) 945-6730
Grades: 6-12
| 98 students
Rank: n/an/a
8012 Shin Oak
San Antonio, TX 78233
(210) 945-5100
San Antonio, TX 78233
(210) 945-5100
Grades: 6-8
| n/a students
Recent Articles

What Is A Charter School?
Explore the world of charter schools in this comprehensive guide. Learn about their history, how they operate, and the pros and cons of this educational innovation. Discover key facts about charter schools, including admission policies, demographics, and funding, as well as what to look for when considering a charter school for your child.

10 Reasons Why High School Sports Benefit Students
Discover the 10 compelling reasons why high school sports are beneficial for students. This comprehensive article explores how athletics enhance academic performance, foster personal growth, and develop crucial life skills. From improved fitness and time management to leadership development and community representation, learn why participating in high school sports can be a game-changer for students' overall success and well-being.

February 05, 2025
Understanding the U.S. Department of Education: Structure, Impact, and EvolutionWe explore how the Department of Education shapes American education, from its cabinet-level leadership to its impact on millions of students, written for general audiences seeking clarity on this vital institution.


