Top Rankings
Northside Independent School District ranks among the top 20% of public school district in Texas for:
Category
Attribute
Community Size
Largest student body (number of students) (Top 1%)
For the 2025 school year, there are 84 public preschools serving 46,417 students in Northside Independent School District. This district's average pre testing ranking is 5/10, which is in the bottom 50% of public pre schools in Texas.
Public Preschools in Northside Independent School District have an average math proficiency score of 37% (versus the Texas public pre school average of 43%), and reading proficiency score of 51% (versus the 53% statewide average).
Minority enrollment is 85% of the student body (majority Hispanic), which is more than the Texas public preschool average of 76% (majority Hispanic).
Overview
This School District
This State (TX)
# Schools
127 Schools
4,192 Schools
# Students
101,095 Students
2,151,418 Students
# Teachers
6,888 Teachers
147,942 Teachers
Student : Teacher Ratio
15:1
15:1
District Rank
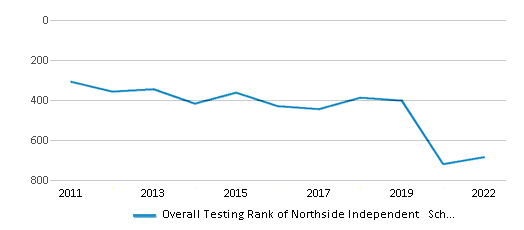
Northside Independent School District, which is ranked #662 of all 1,196 school districts in Texas (based off of combined math and reading proficiency testing data) for the 2021-2022 school year.
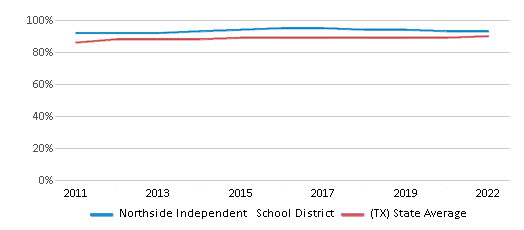
The school district's graduation rate of 93% has decreased from 95% over five school years.
Overall District Rank
#685 out of 1204 school districts
(Bottom 50%)
(Bottom 50%)
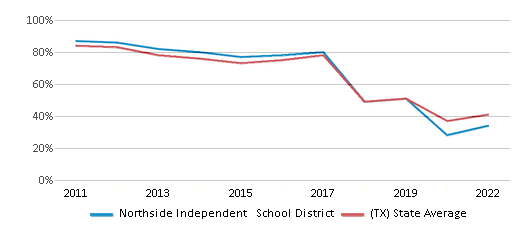
Math Test Scores (% Proficient)
34%
41%
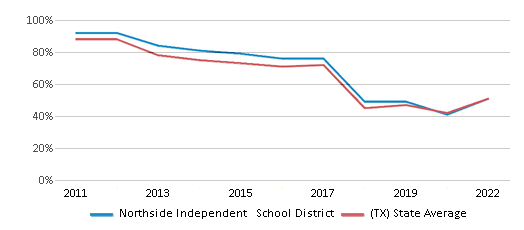
Reading/Language Arts Test Scores (% Proficient)
51%
51%
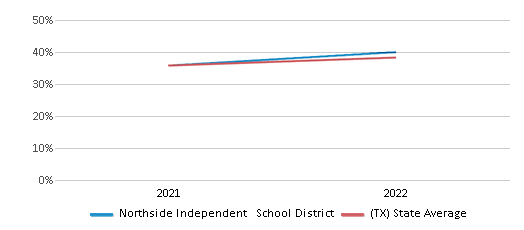
Science Test Scores (% Proficient)
48%
46%
Graduation Rate
93%
90%
Students by Ethnicity:
Diversity Score
0.51
0.63
# American Indian Students
136 Students
6,302 Students
% American Indian Students
n/a
n/a
# Asian Students
4,270 Students
104,203 Students
% Asian Students
4%
5%
# Hispanic Students
68,914 Students
1,180,208 Students
% Hispanic Students
68%
55%
# Black Students
7,008 Students
275,255 Students
% Black Students
7%
13%
# White Students
16,290 Students
509,082 Students
% White Students
16%
24%
# Hawaiian Students
167 Students
3,291 Students
% Hawaiian Students
n/a
n/a
# Two or more races Students
4,310 Students
73,077 Students
% of Two or more races Students
5%
3%
Students by Grade:
# Students in PK Grade:
4,692
275,832
# Students in K Grade:
6,260
307,607
# Students in 1st Grade:
6,761
310,480
# Students in 2nd Grade:
7,154
317,113
# Students in 3rd Grade:
7,156
300,451
# Students in 4th Grade:
7,080
295,281
# Students in 5th Grade:
7,296
258,890
# Students in 6th Grade:
7,007
33,806
# Students in 7th Grade:
7,341
14,241
# Students in 8th Grade:
7,613
12,959
# Students in 9th Grade:
8,944
7,002
# Students in 10th Grade:
8,431
6,366
# Students in 11th Grade:
8,080
5,781
# Students in 12th Grade:
7,280
5,609
# Ungraded Students:
-
-
District Revenue and Spending
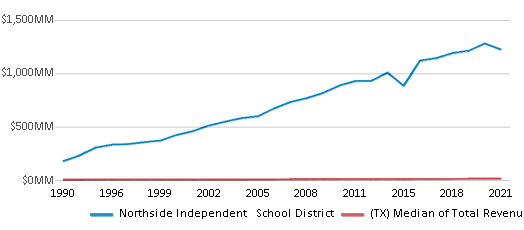
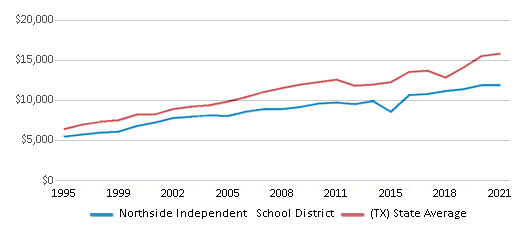
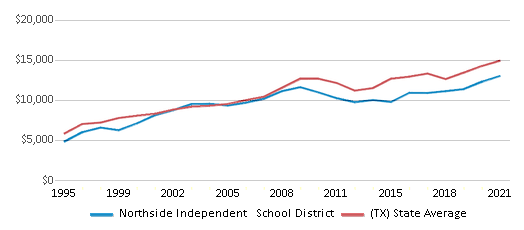
The revenue/student of $12,103 in this school district is less than the state median of $13,387. The school district revenue/student has stayed relatively flat over four school years.
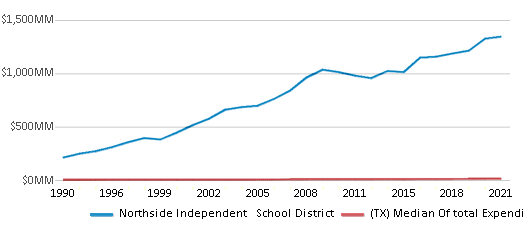
The school district's spending/student of $13,300 is less than the state median of $14,116. The school district spending/student has stayed relatively flat over four school years.
Total Revenue
$1,224 MM
$74,029 MM
Spending
$1,345 MM
$78,063 MM
Revenue / Student
$12,103
$13,387
Spending / Student
$13,300
$14,116
Best Northside Independent School District Public Preschools (2025)
School
(Math and Reading Proficiency)
(Math and Reading Proficiency)
Location
Grades
Students
Rank: #11.
Blattman Elementary School
(Math: 75% | Reading: 80%)
Rank:
Rank:
10/
Top 5%10
3300 N Loop 1604 W
San Antonio, TX 78231
(210) 397-4600
San Antonio, TX 78231
(210) 397-4600
Grades: PK-5
| 493 students
Rank: #22.
Mcandrew Elementary School
(Math: 60-64% | Reading: 80-84%)
Rank:
Rank:
10/
Top 10%10
26615 Toutant Beauregard
Boerne, TX 78006
(210) 398-1750
Boerne, TX 78006
(210) 398-1750
Grades: PK-5
| 303 students
Rank: #33.
Beard Elementary School
(Math: 67% | Reading: 73%)
Rank:
Rank:
10/
Top 10%10
8725 Sonoma Pkwy
Helotes, TX 78023
(210) 397-6600
Helotes, TX 78023
(210) 397-6600
Grades: PK-5
| 559 students
Rank: #44.
Aue Elementary School
(Math: 63% | Reading: 72%)
Rank:
Rank:
10/
Top 10%10
24750 Baywater Stage
San Antonio, TX 78255
(210) 397-6750
San Antonio, TX 78255
(210) 397-6750
Grades: PK-5
| 568 students
Rank: #55.
Helotes Elementary School
(Math: 60-64% | Reading: 70-74%)
Rank:
Rank:
10/
Top 10%10
13878 Riggs Rd
Helotes, TX 78023
(210) 397-3800
Helotes, TX 78023
(210) 397-3800
Grades: PK-5
| 313 students
Rank: #66.
Steubing Elementary School
(Math: 61% | Reading: 68%)
Rank:
Rank:
9/
Top 20%10
11655 Braefield
San Antonio, TX 78249
(210) 397-4350
San Antonio, TX 78249
(210) 397-4350
Grades: PK-5
| 428 students
Rank: #77.
Los Reyes Elementary School
(Math: 52% | Reading: 71%)
Rank:
Rank:
9/
Top 20%10
10785 Triana Pkwy
Helotes, TX 78023
(210) 398-1200
Helotes, TX 78023
(210) 398-1200
Grades: PK-5
| 464 students
Rank: #88.
Scobee Elementary School
(Math: 53% | Reading: 66%)
Rank:
Rank:
9/
Top 20%10
11223 Cedar Park
San Antonio, TX 78249
(210) 397-0700
San Antonio, TX 78249
(210) 397-0700
Grades: PK-5
| 474 students
Rank: #99.
Raba Elementary School
(Math: 53% | Reading: 64%)
Rank:
Rank:
8/
Top 30%10
9740 Misty Rock
San Antonio, TX 78251
(210) 397-1350
San Antonio, TX 78251
(210) 397-1350
Grades: PK-5
| 553 students
Rank: #1010.
Cole Elementary School
(Math: 52% | Reading: 64%)
Rank:
Rank:
8/
Top 30%10
13185 Tillman Ridge
San Antonio, TX 78253
(210) 398-2100
San Antonio, TX 78253
(210) 398-2100
Grades: PK-5
| 1,203 students
Rank: #1111.
Leon Springs Elementary School
(Math: 47% | Reading: 65%)
Rank:
Rank:
8/
Top 30%10
23881 Ih 10 W
San Antonio, TX 78257
(210) 397-4400
San Antonio, TX 78257
(210) 397-4400
Grades: PK-5
| 438 students
Rank: #1212.
Wernli Elementary School
(Math: 49% | Reading: 62%)
Rank:
Rank:
8/
Top 30%10
1881 Arcadia Path
San Antonio, TX 78245
(210) 398-2450
San Antonio, TX 78245
(210) 398-2450
Grades: PK-5
| 774 students
Rank: #1313.
Kallison Elementary School
(Math: 49% | Reading: 60%)
Rank:
Rank:
8/
Top 30%10
8610 Ranch View E
San Antonio, TX 78254
(210) 398-2350
San Antonio, TX 78254
(210) 398-2350
Grades: PK-5
| 1,141 students
Rank: #1414.
Carson Elementary School
(Math: 45% | Reading: 64%)
Rank:
Rank:
8/
Top 30%10
8151 Old Tezel Rd
San Antonio, TX 78250
(210) 397-1100
San Antonio, TX 78250
(210) 397-1100
Grades: PK-5
| 509 students
Rank: #1515.
Ellison Elementary School
(Math: 46% | Reading: 62%)
Rank:
Rank:
8/
Top 30%10
7132 Oak Dr
San Antonio, TX 78256
(210) 398-1850
San Antonio, TX 78256
(210) 398-1850
Grades: PK-5
| 754 students
Rank: #1616.
Tomlinson Elementary School
(Math: 45% | Reading: 62%)
Rank:
Rank:
8/
Top 30%10
9748 Swayback Ranch
San Antonio, TX 78254
(210) 398-2650
San Antonio, TX 78254
(210) 398-2650
Grades: PK-5
| 777 students
Rank: #1717.
Mireles Elementary School
(Math: 47% | Reading: 59%)
Rank:
Rank:
8/
Top 30%10
12260 Rockwall Mill
San Antonio, TX 78253
(210) 398-1500
San Antonio, TX 78253
(210) 398-1500
Grades: PK-5
| 848 students
Rank: #1818.
Kuentz Elementary School
(Math: 45% | Reading: 59%)
Rank:
Rank:
7/
Top 50%10
12303 Leslie Rd
Helotes, TX 78023
(210) 397-8050
Helotes, TX 78023
(210) 397-8050
Grades: PK-5
| 542 students
Rank: #1919.
Fields Elementary School
(Math: 45% | Reading: 57%)
Rank:
Rank:
7/
Top 50%10
9570 Fm 1560 N
San Antonio, TX 78254
(210) 398-2150
San Antonio, TX 78254
(210) 398-2150
Grades: PK-5
| 812 students
Rank: #2020.
Braun Station Elementary School
(Math: 49% | Reading: 53%)
Rank:
Rank:
7/
Top 50%10
8631 Tezel Rd
San Antonio, TX 78254
(210) 397-1550
San Antonio, TX 78254
(210) 397-1550
Grades: PK-5
| 359 students
Rank: #21 - 2221. - 22.
Krueger Elementary School
(Math: 42% | Reading: 59%)
Rank:
Rank:
7/
Top 50%10
9900 Wildhorse Pkwy
San Antonio, TX 78254
(210) 397-3850
San Antonio, TX 78254
(210) 397-3850
Grades: PK-5
| 504 students
Rank: #21 - 2221. - 22.
Scarborough Elementary School
(Math: 42% | Reading: 59%)
Rank:
Rank:
7/
Top 50%10
12280 Silver Pointe
San Antonio, TX 78238
(210) 397-8000
San Antonio, TX 78238
(210) 397-8000
Grades: PK-5
| 921 students
Rank: #2323.
Holmgreen Center
Alternative School
(Math: ≥50% | Reading: ≥50% )
Rank:
Rank:
7/
Top 50%10
8580 Ewing Halsell
San Antonio, TX 78229
(210) 397-5460
San Antonio, TX 78229
(210) 397-5460
Grades: PK-12
| 55 students
Rank: #2424.
Hoffmann Elementary School
(Math: 41% | Reading: 60%)
Rank:
Rank:
7/
Top 50%10
12118 Volunteer Pkwy
San Antonio, TX 78253
(210) 397-8350
San Antonio, TX 78253
(210) 397-8350
Grades: PK-5
| 820 students
Rank: #2525.
Langley Elementary School
(Math: 41% | Reading: 58%)
Rank:
Rank:
7/
Top 50%10
14185 Bella Vista Place
San Antonio, TX 78253
(210) 397-0150
San Antonio, TX 78253
(210) 397-0150
Grades: PK-5
| 658 students
Rank: #2626.
Franklin Elementary School
(Math: 38% | Reading: 58%)
Rank:
Rank:
6/
Top 50%10
9180 Silver Spot
San Antonio, TX 78254
(210) 398-1700
San Antonio, TX 78254
(210) 398-1700
Grades: PK-5
| 724 students
Rank: #2727.
Boldt Elementary School
(Math: 40% | Reading: 56%)
Rank:
Rank:
6/
Top 50%10
310 Hollimon Pkwy
San Antonio, TX 78253
(210) 398-2000
San Antonio, TX 78253
(210) 398-2000
Grades: PK-5
| 926 students
Rank: #28 - 2928. - 29.
Burke Elementary School
(Math: 37% | Reading: 57%)
Rank:
Rank:
6/
Top 50%10
10111 Terra Oak
San Antonio, TX 78250
(210) 397-1300
San Antonio, TX 78250
(210) 397-1300
Grades: PK-5
| 541 students
Rank: #28 - 2928. - 29.
Nichols Elementary School
(Math: 35-39% | Reading: 55-59%)
Rank:
Rank:
6/
Top 50%10
9560 Braun Rd
San Antonio, TX 78254
(210) 397-4050
San Antonio, TX 78254
(210) 397-4050
Grades: PK-5
| 343 students
Rank: #3030.
Wanke Elementary School
(Math: 41% | Reading: 54%)
Rank:
Rank:
6/
Top 50%10
10419 Old Prue Rd
San Antonio, TX 78249
(210) 397-6700
San Antonio, TX 78249
(210) 397-6700
Grades: PK-5
| 662 students
Rank: #3131.
Ward Elementary School
(Math: 39% | Reading: 56%)
Rank:
Rank:
6/
Top 50%10
8400 Cavern Hill
San Antonio, TX 78254
(210) 397-6800
San Antonio, TX 78254
(210) 397-6800
Grades: PK-5
| 777 students
Rank: #3232.
Lieck Elementary School
(Math: 37% | Reading: 56%)
Rank:
Rank:
6/
Top 50%10
12600 Reid Ranch
San Antonio, TX 78245
(210) 398-1450
San Antonio, TX 78245
(210) 398-1450
Grades: PK-5
| 626 students
Rank: #3333.
Fisher Elementary School
(Math: 40% | Reading: 53%)
Rank:
Rank:
6/
Top 50%10
3430 Barrel Pass
San Antonio, TX 78245
(210) 397-4450
San Antonio, TX 78245
(210) 397-4450
Grades: PK-5
| 560 students
Rank: #3434.
Ott Elementary School
(Math: 40% | Reading: 52%)
Rank:
Rank:
6/
Top 50%10
100 N Grosenbacher
San Antonio, TX 78253
(210) 397-5550
San Antonio, TX 78253
(210) 397-5550
Grades: PK-5
| 589 students
Rank: #3535.
Fernandez Elementary School
(Math: 35% | Reading: 53%)
Rank:
Rank:
6/
Top 50%10
6845 Ridgebrook
San Antonio, TX 78250
(210) 397-1900
San Antonio, TX 78250
(210) 397-1900
Grades: PK-5
| 454 students
Show 49 more public schools in Northside Independent School District (out of 84 total schools)
Loading...
Recent Articles

What Is A Charter School?
Explore the world of charter schools in this comprehensive guide. Learn about their history, how they operate, and the pros and cons of this educational innovation. Discover key facts about charter schools, including admission policies, demographics, and funding, as well as what to look for when considering a charter school for your child.

10 Reasons Why High School Sports Benefit Students
Discover the 10 compelling reasons why high school sports are beneficial for students. This comprehensive article explores how athletics enhance academic performance, foster personal growth, and develop crucial life skills. From improved fitness and time management to leadership development and community representation, learn why participating in high school sports can be a game-changer for students' overall success and well-being.

February 05, 2025
Understanding the U.S. Department of Education: Structure, Impact, and EvolutionWe explore how the Department of Education shapes American education, from its cabinet-level leadership to its impact on millions of students, written for general audiences seeking clarity on this vital institution.


