For the 2025 school year, there are 4 public preschools serving 1,541 students in Zapata County Independent School District. This district's average pre testing ranking is 4/10, which is in the bottom 50% of public pre schools in Texas.
Public Preschools in Zapata County Independent School District have an average math proficiency score of 42% (versus the Texas public pre school average of 43%), and reading proficiency score of 42% (versus the 53% statewide average).
Minority enrollment is 100% of the student body (majority Hispanic), which is more than the Texas public preschool average of 76% (majority Hispanic).
Overview
This School District
This State (TX)
# Schools
6 Schools
4,192 Schools
# Students
3,359 Students
2,151,418 Students
# Teachers
236 Teachers
147,942 Teachers
Student : Teacher Ratio
14:1
14:1
District Rank
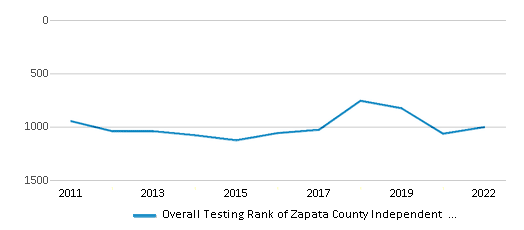
Zapata County Independent School District, which is ranked #991 of all 1,196 school districts in Texas (based off of combined math and reading proficiency testing data) for the 2021-2022 school year.
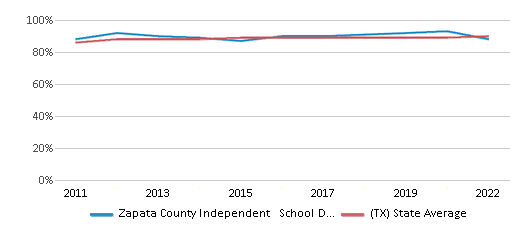
The school district's graduation rate of 88% has decreased from 90% over five school years.
Overall District Rank
#1002 out of 1204 school districts
(Bottom 50%)
(Bottom 50%)
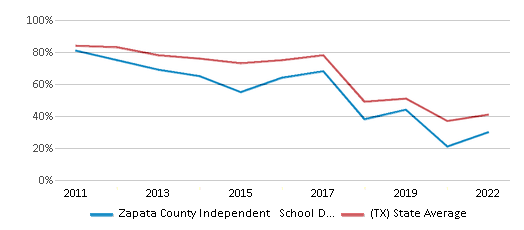
Math Test Scores (% Proficient)
30%
41%
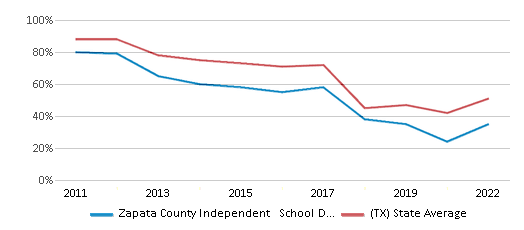
Reading/Language Arts Test Scores (% Proficient)
35%
51%
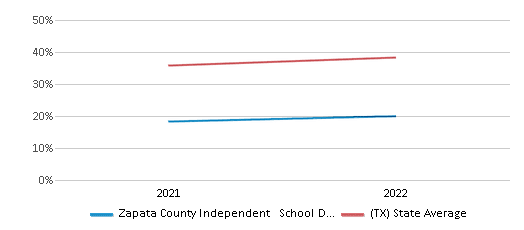
Science Test Scores (% Proficient)
24%
46%
Graduation Rate
88%
90%
Students by Ethnicity:
Diversity Score
0.01
0.63
# American Indian Students
n/a
6,302 Students
% American Indian Students
n/a
n/a
# Asian Students
2 Students
104,203 Students
% Asian Students
n/a
5%
# Hispanic Students
3,345 Students
1,180,208 Students
% Hispanic Students
100%
55%
# Black Students
1 Student
275,255 Students
% Black Students
n/a
13%
# White Students
11 Students
509,082 Students
% White Students
n/a
24%
# Hawaiian Students
n/a
3,291 Students
% Hawaiian Students
n/a
n/a
# Two or more races Students
n/a
73,077 Students
% of Two or more races Students
n/a
3%
Students by Grade:
# Students in PK Grade:
189
275,832
# Students in K Grade:
218
307,607
# Students in 1st Grade:
212
310,480
# Students in 2nd Grade:
213
317,113
# Students in 3rd Grade:
232
300,451
# Students in 4th Grade:
248
295,281
# Students in 5th Grade:
229
258,890
# Students in 6th Grade:
240
33,806
# Students in 7th Grade:
258
14,241
# Students in 8th Grade:
252
12,959
# Students in 9th Grade:
280
7,002
# Students in 10th Grade:
283
6,366
# Students in 11th Grade:
252
5,781
# Students in 12th Grade:
253
5,609
# Ungraded Students:
-
-
District Revenue and Spending
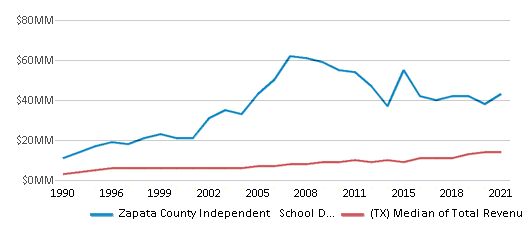
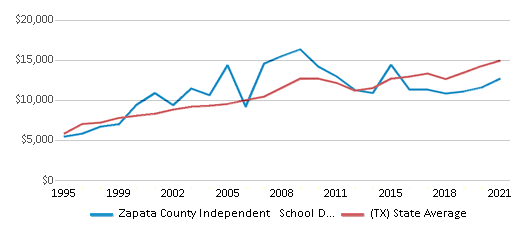
The revenue/student of $12,795 in this school district is less than the state median of $13,387. The school district revenue/student has stayed relatively flat over four school years.
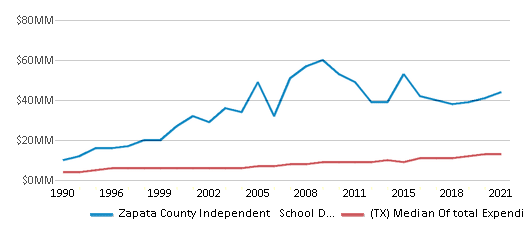
The school district's spending/student of $13,145 is less than the state median of $14,116. The school district spending/student has stayed relatively flat over four school years.
Total Revenue
$43 MM
$74,029 MM
Spending
$44 MM
$78,063 MM
Revenue / Student
$12,795
$13,387
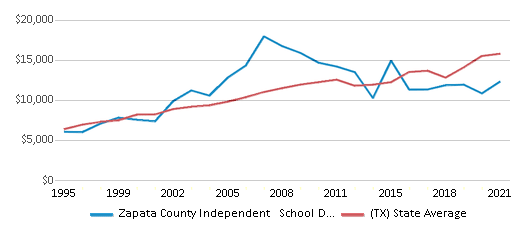
Spending / Student
$13,145
$14,116
Best Zapata County Independent School District Public Preschools (2025)
School
(Math and Reading Proficiency)
(Math and Reading Proficiency)
Location
Grades
Students
Rank: #11.
Fidel And Andrea R Villarreal Elementary School
(Math: 47% | Reading: 42%)
Rank:
Rank:
6/
Top 50%10
805 Mira Flores St
Zapata, TX 78076
(956) 765-4321
Zapata, TX 78076
(956) 765-4321
Grades: PK-5
| 463 students
Rank: #22.
Zapata South Elementary School
(Math: 39% | Reading: 48%)
Rank:
Rank:
5/
Bottom 50%10
500 Delmar St
Zapata, TX 78076
(956) 765-4332
Zapata, TX 78076
(956) 765-4332
Grades: PK-5
| 442 students
Rank: #33.
Benavides Elementary School
(Math: 40-59% | Reading: 21-39%)
Rank:
Rank:
4/
Bottom 50%10
307 Lincoln St
Zapata, TX 78076
(956) 765-5611
Zapata, TX 78076
(956) 765-5611
Grades: PK-5
| 61 students
Rank: #44.
Zapata North Elementary School
(Math: 39% | Reading: 38%)
Rank:
Rank:
4/
Bottom 50%10
502 E 17th Ave
Zapata, TX 78076
(956) 765-6921
Zapata, TX 78076
(956) 765-6921
Grades: PK-5
| 575 students
Recent Articles

What Is A Charter School?
Explore the world of charter schools in this comprehensive guide. Learn about their history, how they operate, and the pros and cons of this educational innovation. Discover key facts about charter schools, including admission policies, demographics, and funding, as well as what to look for when considering a charter school for your child.

10 Reasons Why High School Sports Benefit Students
Discover the 10 compelling reasons why high school sports are beneficial for students. This comprehensive article explores how athletics enhance academic performance, foster personal growth, and develop crucial life skills. From improved fitness and time management to leadership development and community representation, learn why participating in high school sports can be a game-changer for students' overall success and well-being.

February 05, 2025
Understanding the U.S. Department of Education: Structure, Impact, and EvolutionWe explore how the Department of Education shapes American education, from its cabinet-level leadership to its impact on millions of students, written for general audiences seeking clarity on this vital institution.


