Top Rankings
Nebo School District ranks among the top 20% of public school district in Utah for:
Category
Attribute
Graduation Rate
Highest graduation rate (Top 20%)
Community Size
Largest student body (number of students) (Top 1%)
For the 2025 school year, there are 47 public schools serving 35,737 students in Nebo School District. This district's average testing ranking is 6/10, which is in the top 50% of public schools in Utah.
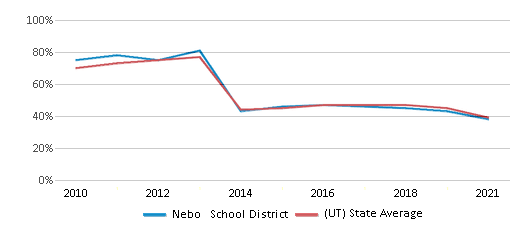
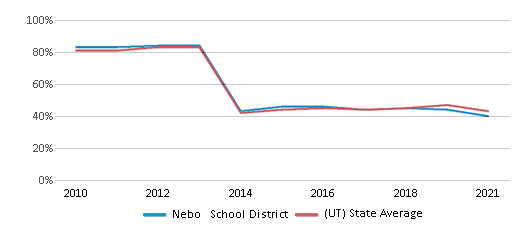
Public Schools in Nebo School District have an average math proficiency score of 38% (versus the Utah public school average of 39%), and reading proficiency score of 40% (versus the 43% statewide average).
Minority enrollment is 22% of the student body (majority Hispanic), which is less than the Utah public school average of 29% (majority Hispanic).
Overview
This School District
This State (UT)
# Schools
47 Schools
1,112 Schools
# Students
35,737 Students
681,035 Students
# Teachers
1,584 Teachers
31,284 Teachers
Student : Teacher Ratio
23:1
23:1
District Rank
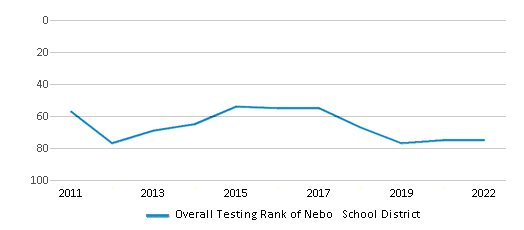
Nebo School District, which is ranked within the top 50% of all 153 school districts in Utah (based off of combined math and reading proficiency testing data) for the 2020-2021 school year.
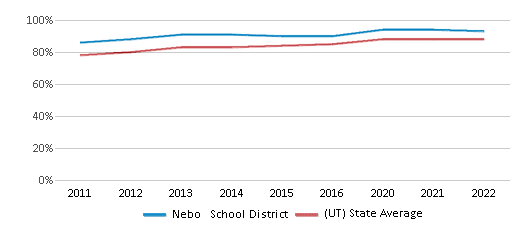
The school district's graduation rate of 93% has increased from 91% over five school years.
Overall District Rank
#75 out of 154 school districts
(Top 50%)
(Top 50%)
Math Test Scores (% Proficient)
(20-21)38%
39%
Reading/Language Arts Test Scores (% Proficient)
(20-21)40%
43%
Science Test Scores (% Proficient)
(20-21)43%
45%
Graduation Rate
93%
88%
Students by Ethnicity:
Diversity Score
0.36
0.46
# American Indian Students
126 Students
6,356 Students
% American Indian Students
n/a
1%
# Asian Students
109 Students
11,203 Students
% Asian Students
n/a
2%
# Hispanic Students
5,772 Students
135,730 Students
% Hispanic Students
16%
20%
# Black Students
181 Students
8,999 Students
% Black Students
1%
1%
# White Students
28,025 Students
481,682 Students
% White Students
78%
71%
# Hawaiian Students
229 Students
10,774 Students
% Hawaiian Students
1%
1%
# Two or more races Students
1,289 Students
26,165 Students
% of Two or more races Students
4%
4%
Students by Grade:
# Students in PK Grade:
926
16,573
# Students in K Grade:
2,468
44,583
# Students in 1st Grade:
2,458
47,327
# Students in 2nd Grade:
2,579
50,032
# Students in 3rd Grade:
2,619
50,137
# Students in 4th Grade:
2,566
50,477
# Students in 5th Grade:
2,611
51,752
# Students in 6th Grade:
2,650
50,580
# Students in 7th Grade:
2,764
52,075
# Students in 8th Grade:
2,648
52,556
# Students in 9th Grade:
2,805
53,806
# Students in 10th Grade:
2,945
55,206
# Students in 11th Grade:
2,931
54,321
# Students in 12th Grade:
2,767
51,610
# Ungraded Students:
-
-
District Revenue and Spending
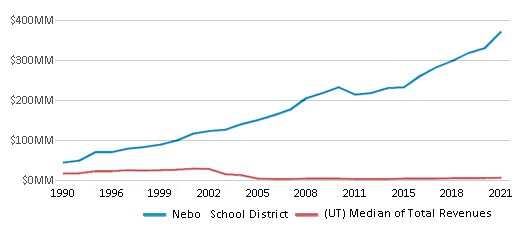
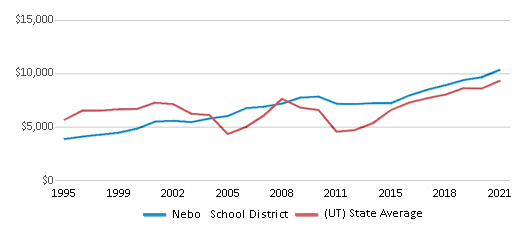
The revenue/student of $10,393 in this school district is less than the state median of $10,732. The school district revenue/student has stayed relatively flat over four school years.
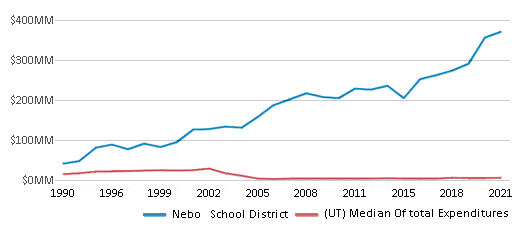
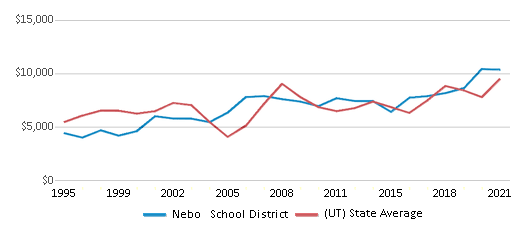
The school district's spending/student of $10,393 is less than the state median of $10,829. The school district spending/student has stayed relatively flat over four school years.
Total Revenue
$371 MM
$7,309 MM
Spending
$371 MM
$7,375 MM
Revenue / Student
$10,393
$10,732
Spending / Student
$10,393
$10,829
Best Nebo School District Public Schools (2025)
School
(Math and Reading Proficiency)
(Math and Reading Proficiency)
Location
Grades
Students
Rank: #11.
Maple Ridge School
(Math: 65% | Reading: 58%)
Rank:
Rank:
10/
Top 10%10
2340 West Harvest Parkway
Mapleton, UT 84664
(801) 489-1800
Mapleton, UT 84664
(801) 489-1800
Grades: PK-6
| 837 students
Rank: #22.
East Meadows School
(Math: 54% | Reading: 54%)
Rank:
Rank:
9/
Top 20%10
1287 S 2130 E
Spanish Fork, UT 84660
(801) 798-4015
Spanish Fork, UT 84660
(801) 798-4015
Grades: PK-6
| 544 students
Rank: #33.
Sage Creek School
(Math: 54% | Reading: 51%)
Rank:
Rank:
9/
Top 20%10
1050 S 700 E
Springville, UT 84663
(801) 489-2860
Springville, UT 84663
(801) 489-2860
Grades: PK-6
| 511 students
Rank: #44.
Hobble Creek School
(Math: 53% | Reading: 49%)
Rank:
Rank:
8/
Top 30%10
1145 E 1200 N
Mapleton, UT 84664
(801) 489-2863
Mapleton, UT 84664
(801) 489-2863
Grades: PK-6
| 468 students
Rank: #55.
Sierra Bonita Elementary School
(Math: 56% | Reading: 47%)
Rank:
Rank:
8/
Top 30%10
53 S 1800 E
Spanish Fork, UT 84660
(801) 798-4480
Spanish Fork, UT 84660
(801) 798-4480
Grades: PK-6
| 593 students
Rank: #66.
Mt. Loafer School
(Math: 52% | Reading: 43%)
Rank:
Rank:
7/
Top 50%10
1025 S 250 W
Salem, UT 84653
(801) 423-2705
Salem, UT 84653
(801) 423-2705
Grades: PK-6
| 668 students
Rank: #77.
Springville High School
(Math: 37% | Reading: 56%)
Rank:
Rank:
7/
Top 50%10
1205 E 900 S
Springville, UT 84663
(801) 489-2870
Springville, UT 84663
(801) 489-2870
Grades: 6-12
| 1,675 students
Rank: #88.
Foothills School
(Math: 49% | Reading: 46%)
Rank:
Rank:
7/
Top 50%10
412 S 810 E
Salem, UT 84653
(801) 423-9172
Salem, UT 84653
(801) 423-9172
Grades: PK-6
| 642 students
Rank: #99.
Mapleton School
(Math: 47% | Reading: 45%)
Rank:
Rank:
7/
Top 50%10
120 W Maple
Mapleton, UT 84664
(801) 489-2850
Mapleton, UT 84664
(801) 489-2850
Grades: PK-6
| 601 students
Rank: #1010.
Maple Mountain High School
(Math: 35% | Reading: 55%)
Rank:
Rank:
7/
Top 50%10
51 N Spanish Fork Pkwy
Spanish Fork, UT 84660
(801) 794-6740
Spanish Fork, UT 84660
(801) 794-6740
Grades: 7-12
| 1,837 students
Rank: #1111.
Art City School
(Math: 45% | Reading: 45%)
Rank:
Rank:
7/
Top 50%10
121 N 900 E
Springville, UT 84663
(801) 489-2820
Springville, UT 84663
(801) 489-2820
Grades: PK-6
| 445 students
Rank: #12 - 1312. - 13.
Bridges Nebo Transition Center
Special Education School
(Math: <50% | Reading: <50% )
Rank:
Rank:
7/
Top 50%10
165 S. 700 E.
Springville, UT 84663
(801) 798-4006
Springville, UT 84663
(801) 798-4006
Grades: PK-12
| 188 students
Rank: #12 - 1312. - 13.
Landmark High School
Alternative School
(Math: <50% | Reading: <50% )
Rank:
Rank:
7/
Top 50%10
612 S Main
Spanish Fork, UT 84660
(801) 798-4030
Spanish Fork, UT 84660
(801) 798-4030
Grades: K-12
| 316 students
Rank: #14 - 1514. - 15.
Riverview School
(Math: 44% | Reading: 43%)
Rank:
Rank:
6/
Top 50%10
628 S West Park Drive
Spanish Fork, UT 84660
(801) 798-4050
Spanish Fork, UT 84660
(801) 798-4050
Grades: PK-6
| 698 students
Rank: #14 - 1514. - 15.
Spring Lake School
(Math: 44% | Reading: 43%)
Rank:
Rank:
6/
Top 50%10
1750 S 500 W
Payson, UT 84651
(801) 465-6070
Payson, UT 84651
(801) 465-6070
Grades: PK-6
| 567 students
Rank: #1616.
Mapleton Junior High School
(Math: 43% | Reading: 43%)
Rank:
Rank:
6/
Top 50%10
362 E 1200 N
Mapleton, UT 84664
(801) 489-2892
Mapleton, UT 84664
(801) 489-2892
Grades: 7-9
| 1,197 students
Rank: #1717.
Cherry Creek School
(Math: 41% | Reading: 42%)
Rank:
Rank:
6/
Top 50%10
484 S 200 E
Springville, UT 84663
(801) 489-2810
Springville, UT 84663
(801) 489-2810
Grades: PK-6
| 483 students
Rank: #1818.
Salem School
(Math: 40% | Reading: 42%)
Rank:
Rank:
6/
Top 50%10
140 W 100 S
Salem, UT 84653
(801) 423-1182
Salem, UT 84653
(801) 423-1182
Grades: PK-6
| 487 students
Rank: #1919.
Spanish Fork High School
(Math: 31% | Reading: 47%)
Rank:
Rank:
5/
Bottom 50%10
99 N 300 W
Spanish Fork, UT 84660
(801) 798-4060
Spanish Fork, UT 84660
(801) 798-4060
Grades: 9-12
| 1,546 students
Rank: #2020.
Canyon School
Magnet School
(Math: 36% | Reading: 44%)
Rank:
Rank:
5/
Bottom 50%10
1492 E 1240 S
Spanish Fork, UT 84660
(801) 798-4610
Spanish Fork, UT 84660
(801) 798-4610
Grades: PK-6
| 463 students
Rank: #2121.
Orchard Hills School
(Math: 46% | Reading: 36%)
Rank:
Rank:
5/
Bottom 50%10
168 E 610 S
Santaquin, UT 84655
(801) 754-5106
Santaquin, UT 84655
(801) 754-5106
Grades: PK-6
| 580 students
Rank: #2222.
Springville Jr High School
(Math: 39% | Reading: 41%)
Rank:
Rank:
5/
Bottom 50%10
165 S 700 E
Springville, UT 84663
(801) 489-2880
Springville, UT 84663
(801) 489-2880
Grades: 7-9
| 1,128 students
Rank: #2323.
Spanish Oaks School
(Math: 46% | Reading: 34%)
Rank:
Rank:
5/
Bottom 50%10
2701 E Canyon Crest Dr
Spanish Fork, UT 84660
(801) 798-7411
Spanish Fork, UT 84660
(801) 798-7411
Grades: PK-6
| 408 students
Rank: #2424.
Salem Hills High School
(Math: 27% | Reading: 47%)
Rank:
Rank:
5/
Bottom 50%10
150 N Skyhawk Blvd
Salem, UT 84653
(801) 423-3200
Salem, UT 84653
(801) 423-3200
Grades: 9-12
| 1,585 students
Rank: #2525.
Brookside School
(Math: 41% | Reading: 37%)
Rank:
Rank:
5/
Bottom 50%10
750 E 400 S
Springville, UT 84663
(801) 489-2830
Springville, UT 84663
(801) 489-2830
Grades: PK-6
| 388 students
Rank: #26 - 2726. - 27.
Rees School
(Math: 43% | Reading: 33%)
Rank:
Rank:
5/
Bottom 50%10
574 N Rees Ave
Spanish Fork, UT 84660
(801) 798-4055
Spanish Fork, UT 84660
(801) 798-4055
Grades: PK-6
| 777 students
Rank: #26 - 2726. - 27.
Taylor School
(Math: 44% | Reading: 30-34%)
Rank:
Rank:
5/
Bottom 50%10
92 S 500 W
Payson, UT 84651
(801) 465-6050
Payson, UT 84651
(801) 465-6050
Grades: PK-6
| 419 students
Rank: #2828.
Spanish Fork Jr High School
(Math: 37% | Reading: 39%)
Rank:
Rank:
5/
Bottom 50%10
600 S 820 E
Spanish Fork, UT 84660
(801) 798-4075
Spanish Fork, UT 84660
(801) 798-4075
Grades: 7-9
| 1,057 students
Rank: #2929.
Salem Junior High School
(Math: 31% | Reading: 42%)
Rank:
Rank:
5/
Bottom 50%10
598 North Main
Salem, UT 84653
(801) 423-6558
Salem, UT 84653
(801) 423-6558
Grades: 7-9
| 953 students
Rank: #3030.
Valley View Middle School
(Math: 36% | Reading: 37%)
Rank:
Rank:
4/
Bottom 50%10
1044 E 340 S
Salem, UT 84653
(801) 609-2795
Salem, UT 84653
(801) 609-2795
Grades: 6-7
| 936 students
Rank: #3131.
Westside School
(Math: 35% | Reading: 37%)
Rank:
Rank:
4/
Bottom 50%10
740 W Center
Springville, UT 84663
(801) 489-2800
Springville, UT 84663
(801) 489-2800
Grades: PK-6
| 622 students
Rank: #3232.
Santaquin School
(Math: 37% | Reading: 34%)
Rank:
Rank:
4/
Bottom 50%10
25 S 400 W
Santaquin, UT 84655
(801) 754-3611
Santaquin, UT 84655
(801) 754-3611
Grades: PK-6
| 677 students
Rank: #33 - 3433. - 34.
Goshen School
(Math: 30-34% | Reading: 35-39%)
Rank:
Rank:
4/
Bottom 50%10
60 N Center
Goshen, UT 84633
(801) 667-3361
Goshen, UT 84633
(801) 667-3361
Grades: PK-6
| 324 students
Rank: #33 - 3433. - 34.
Park View School
(Math: 30-34% | Reading: 35-39%)
Rank:
Rank:
4/
Bottom 50%10
360 S 100 E
Payson, UT 84651
(801) 465-6010
Payson, UT 84651
(801) 465-6010
Grades: PK-6
| 357 students
Rank: #3535.
Wilson School
(Math: 35-39% | Reading: 30-34%)
Rank:
Rank:
4/
Bottom 50%10
590 W 500 S
Payson, UT 84651
(801) 465-6060
Payson, UT 84651
(801) 465-6060
Grades: PK-6
| 367 students
Show 12 more public schools in Nebo School District (out of 47 total schools)
Loading...
Frequently Asked Questions
How many schools belong to Nebo School District?
Nebo School District manages 47 public schools serving 35,737 students.
What is the rank of Nebo School District?
Nebo School District is ranked #71 out of 153 school districts in Utah (top 50%) based off of combined math and reading proficiency testing data for the 2020-2021 school year. This district ranks in the top 20% of Utah school districts for: Highest graduation rate (Top 20%) and Largest student body (number of students) (Top 1%)
What is the racial composition of students in Nebo School District?
78% of Nebo School District students are White, 16% of students are Hispanic, 4% of students are Two or more races, 1% of students are Black, and 1% of students are Hawaiian.
What is the student/teacher ratio of Nebo School District?
Nebo School District has a student/teacher ratio of 23:1, which is higher than the Utah state average of 22:1.
What is Nebo School District's spending/student ratio?
The school district's spending/student of $10,393 is less than the state median of $10,829. The school district spending/student has stayed relatively flat over four school years.
Recent Articles

What Is A Charter School?
Explore the world of charter schools in this comprehensive guide. Learn about their history, how they operate, and the pros and cons of this educational innovation. Discover key facts about charter schools, including admission policies, demographics, and funding, as well as what to look for when considering a charter school for your child.

10 Reasons Why High School Sports Benefit Students
Discover the 10 compelling reasons why high school sports are beneficial for students. This comprehensive article explores how athletics enhance academic performance, foster personal growth, and develop crucial life skills. From improved fitness and time management to leadership development and community representation, learn why participating in high school sports can be a game-changer for students' overall success and well-being.

February 05, 2025
Understanding the U.S. Department of Education: Structure, Impact, and EvolutionWe explore how the Department of Education shapes American education, from its cabinet-level leadership to its impact on millions of students, written for general audiences seeking clarity on this vital institution.


