Serving 1,072 students in grades 9-12, West Warwick High School ranks in the top 50% of all schools in Rhode Island for overall test scores (math proficiency is bottom 50%, and reading proficiency is bottom 50%).
The percentage of students achieving proficiency in math is 20-24% (which is lower than the Rhode Island state average of 27%). The percentage of students achieving proficiency in reading/language arts is 40-44% (which is higher than the Rhode Island state average of 33%).
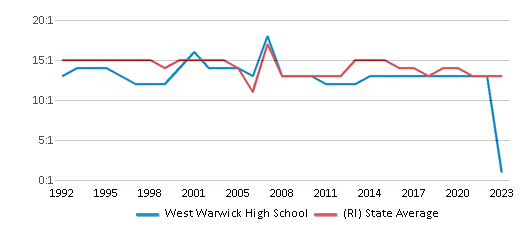
The student:teacher ratio of 13:1 is equal to the Rhode Island state level of 13:1.
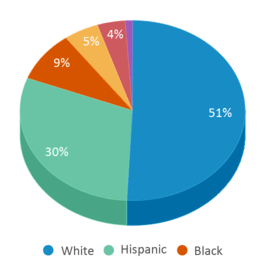
Minority enrollment is 37% of the student body (majority Hispanic), which is lower than the Rhode Island state average of 49% (majority Hispanic).
Quick Stats (2025)
- Grades: 9-12
- Enrollment: 1,072 students
- Student:Teacher Ratio: 13:1
- Minority Enrollment: 37%
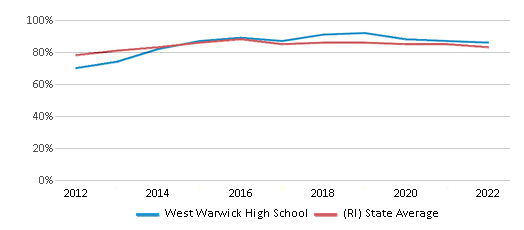
- Graduation Rate: 86% (Btm 50% in RI)
- Overall Testing Rank: Top 50%
- Math Proficiency: 20-24% (Btm 50%)
- Reading Proficiency: 40-44% (Top 50%)
- Science Proficiency: 11% (Btm 50%)
- Source: National Center for Education Statistics (NCES), RI Dept. of Education
School Overview
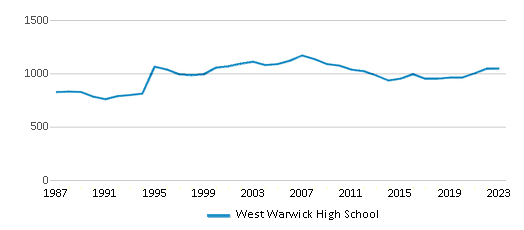
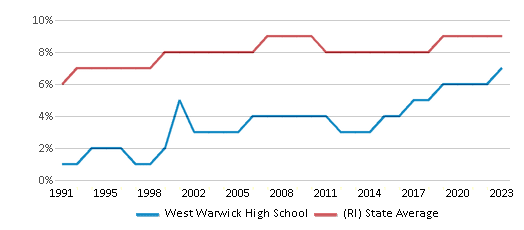
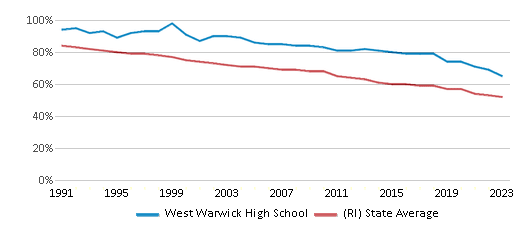
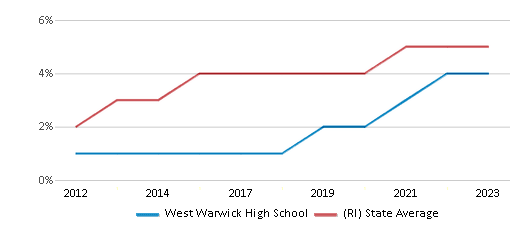
West Warwick High School's student population of 1,072 students has grown by 11% over five school years.
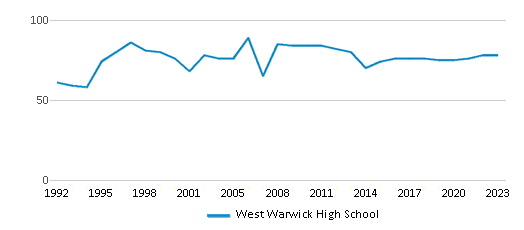
The teacher population of 80 teachers has grown by 6% over five school years.
Grades Offered
Grades 9-12
Total Students
1,072 students
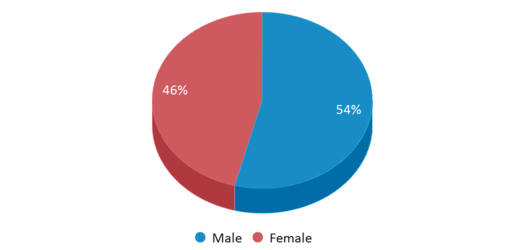
Gender %
Total Classroom Teachers
80 teachers
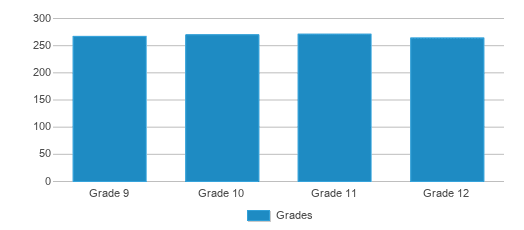
Students by Grade
School Rankings
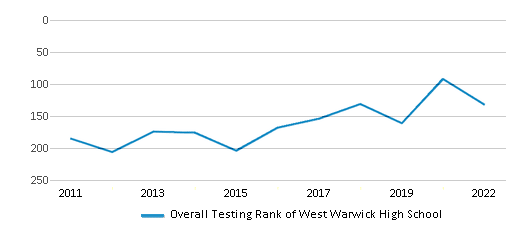
West Warwick High School ranks within the top 50% of all 289 schools in Rhode Island (based off of combined math and reading proficiency testing data).
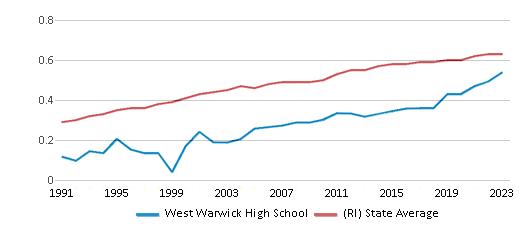
The diversity score of West Warwick High School is 0.56, which is less than the diversity score at state average of 0.65. The school's diversity has stayed relatively flat over five school years.
Overall Testing Rank
#132 out of 289 schools
(Top 50%)
(Top 50%)
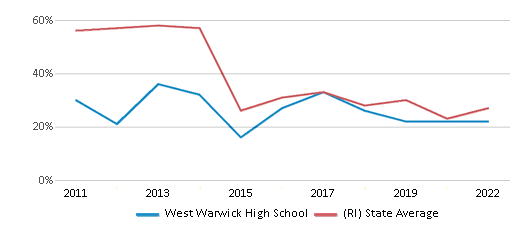
Math Test Scores (% Proficient)
20-24%
27%
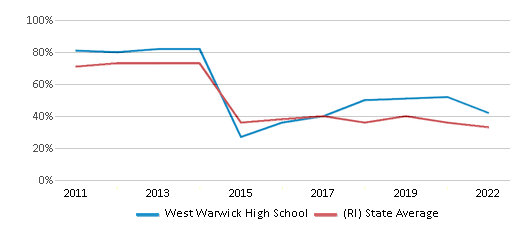
Reading/Language Arts Test Scores (% Proficient)
40-44%
33%
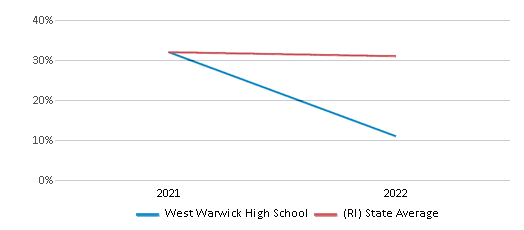
Science Test Scores (% Proficient)
11%
31%
Student : Teacher Ratio
13:1
13:1
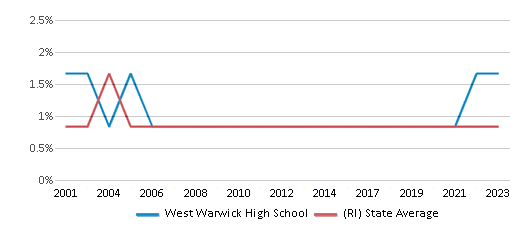
American Indian
2%
1%
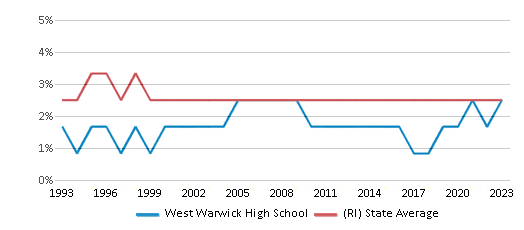
Asian
3%
4%
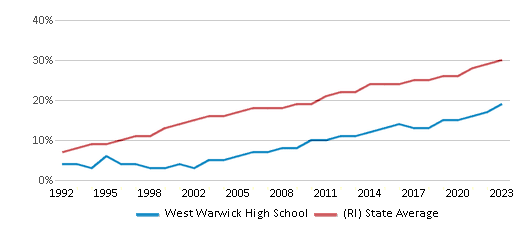
Hispanic
21%
30%
Black
7%
9%
White
63%
51%
Hawaiian
n/a
n/a
Two or more races
4%
5%
All Ethnic Groups
Graduation Rate
86%
83%
Participates in the National School Lunch Program (NSLP)
Yes
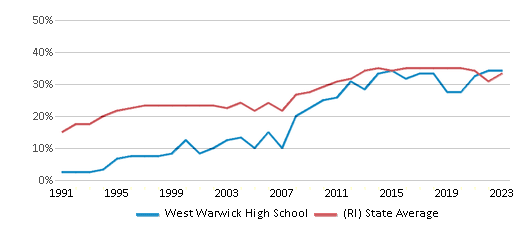
Eligible for Free Lunch
30%
38%
Eligible for Reduced Lunch
5%
6%
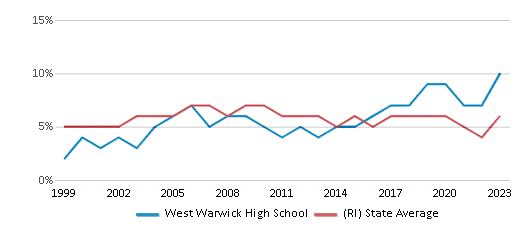
School Statewide Testing
School District Name
Source: National Center for Education Statistics (NCES), RI Dept. of Education
Profile last updated: 02/09/2025
Frequently Asked Questions
What is West Warwick High School's ranking?
West Warwick High School is ranked #132 out of 289 schools, which ranks it among the top 50% of public schools in Rhode Island.
What schools are West Warwick High School often compared to?
West Warwick High Schoolis often viewed alongside schools like Toll Gate High School by visitors of our site.
What percent of students have achieved state testing proficiency in math and reading?
20-24% of students have achieved math proficiency (compared to the 27% RI state average), while 40-44% of students have achieved reading proficiency (compared to the 33% RI state average).
What is the graduation rate of West Warwick High School?
The graduation rate of West Warwick High School is 86%, which is higher than the Rhode Island state average of 83%.
How many students attend West Warwick High School?
1,072 students attend West Warwick High School.
What is the racial composition of the student body?
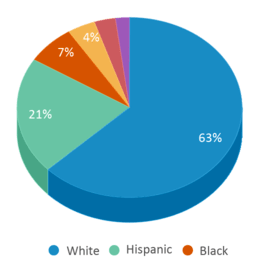
63% of West Warwick High School students are White, 21% of students are Hispanic, 7% of students are Black, 4% of students are Two or more races, 3% of students are Asian, and 2% of students are American Indian.
What is the student:teacher ratio of West Warwick High School?
West Warwick High School has a student ration of 13:1, which is equal to the Rhode Island state average of 13:1.
What grades does West Warwick High School offer ?
West Warwick High School offers enrollment in grades 9-12
What school district is West Warwick High School part of?
West Warwick High School is part of West Warwick School District.
School Reviews
5 5/9/2022
I Attended WWHS from ''94-''98. This was an extremely unique and evolving time in high school, and even more so in our lives. I like to call it the ''Full Circle of an Education''. Allow me to explain- In 1994, as 9th graders, our class was bumped up to the high school building becoming the 1st freshman class to be in the High School building rather than the middle school building in a Long time. Now, there were some positives and some negatives with this change. No longer were we going to be the BigClassOnCampus 9th graders at Deering Middle School... we now had to adapt to being the low class on the totem poll, sharing the same building as Sophomores, juniors and OMG Seniors! Although we were back to being the youngest people in the building once again, the experience helped us All bond and definitely grow up faster than we might have otherwise. Additionally, we had our own freshman sports! Freshman football, basketball, baseball, etc; As an athlete, I really loved that concept- it was probably the only way I was making the baseball team- but hey, I didn''t make the rules. As far as the quality of the education at WWHS, it was certainly above average with Honors programs and Intensive College Preparatory classes available. These classes were well taught, challenging and rewarding. Most teachers were mentors as well as educators. I''d say there was a balanced mix of veterans, old school instructors, and new school academics which helped keep class time refreshing. Then in the summer of 1997, the summer between our junior and senior years, Construction began as an incredible addition to our High school building causing the high school to be temporarily shut down. You can guess what happened next, right? Of course! The high school kids had to use the middle school building again and Us 12th graders were about to commence our Senior year back to the place that had seemingly displaced us just 3 years prior. Since we had to share a single building with the middle schoolers, essentially doubling the number of students, we had the fortune of experiencing school in what was called Double Sessions. How this maneuver succeeded was that the 9th-12th graders attended classes from around 6:45-7am until about 12:30 in the afternoon straight through, no lunch, while 7th-8th graders had classes that started around 1-1:30pm and extended until around 6 pm! Imagine that! Getting out of school at Noon, packing up your car with five or six of your friends, and driving to McDonald's, Burger King, Taco Bell, or anywhere we wanted to grab lunch, and kick back and relax. It was incredible freedom! If you played a fall sport you had to be back at around 3pm for practice, and game nights I''d show up later than that. If you didn''t take part in any after-school activities, then you were done for the day! A teenagers definition of Total Nirvana! Well, Construction ended in the late fall and here''s where the ''Full Circle of an Education'' I mentioned earlier comes in. Us 12th graders were able to return to our rightful home! We were able to Christen our new, renovated, bigger, better building to finish our Senior year! And as a sense of normalcy had returned, I know I''m not the only one who somewhat missed hearing that last HarmonicaRing of the final class bell at 12 in the afternoon. However, I did begin this by saying that this was an extremely unique and evolving time in our lives. Finally! Finally we were kings and queens of the hill! The Proverbial hill, and the literal hill that our school sat atop. It was a 4 year journey that saw our class thrust into a humongous building as freshmen, outnumbered 3-1 by upperclassmen. A 4 year journey that saw our class adapt and grow. A journey that took us back in time to the place that we weren''t able to rule in 1994. But maybe we weren''t meant to be stopped, and 1994 wasn''t the right time. It was actually in 1997 that we conquered that old and familiar middle school building! And most importantly, it was a journey that brought us Full Circle in our Education! Not just Our textbook education but education and evolution in life. Together We had concluded our lives at WWHS unequivocally In a Class By Ourselves!
2 2/10/2020
My son has been a student in the West Warwick public schools since the first grade. It has been an amazing experience. His teachers have all been fantastic since becoming a student. I cannot say enough great things about his high school experience!
Review West Warwick High School. Reviews should be a few sentences in length. Please include any comments on:
- Quality of academic programs, teachers, and facilities
- Availability of music, art, sports and other extracurricular activities
Recent Articles

What Is A Charter School?
Explore the world of charter schools in this comprehensive guide. Learn about their history, how they operate, and the pros and cons of this educational innovation. Discover key facts about charter schools, including admission policies, demographics, and funding, as well as what to look for when considering a charter school for your child.

10 Reasons Why High School Sports Benefit Students
Discover the 10 compelling reasons why high school sports are beneficial for students. This comprehensive article explores how athletics enhance academic performance, foster personal growth, and develop crucial life skills. From improved fitness and time management to leadership development and community representation, learn why participating in high school sports can be a game-changer for students' overall success and well-being.

February 05, 2025
Understanding the U.S. Department of Education: Structure, Impact, and EvolutionWe explore how the Department of Education shapes American education, from its cabinet-level leadership to its impact on millions of students, written for general audiences seeking clarity on this vital institution.


