Top Rankings
Mobile County School District ranks among the top 20% of public school district in Alabama for:
Category
Attribute
Diversity
Most diverse schools (Top 1%)
Community Size
Largest student body (number of students) (Top 1%)
For the 2025 school year, there are 20 public high schools serving 15,328 students in Mobile County School District. This district's average high testing ranking is 3/10, which is in the bottom 50% of public high schools in Alabama.
Public High Schools in Mobile County School District have an average math proficiency score of 16% (versus the Alabama public high school average of 22%), and reading proficiency score of 24% (versus the 37% statewide average).
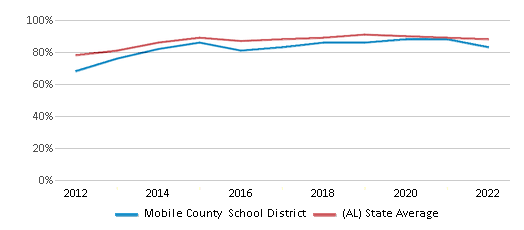
Public High School in Mobile County School District have a Graduation Rate of 83%, which is less than the Alabama average of 88%.
The school with highest graduation rate is Mattie T Blount High School, with 94% graduation rate. Read more about public school graduation rate statistics in Alabama or national school graduation rate statistics.
Minority enrollment is 64% of the student body (majority Black), which is more than the Alabama public high school average of 45% (majority Black).
Overview
This School District
This State (AL)
# Schools
92 Schools
524 Schools
# Students
50,929 Students
269,281 Students
# Teachers
2,878 Teachers
15,139 Teachers
Student : Teacher Ratio
18:1
18:1
District Rank
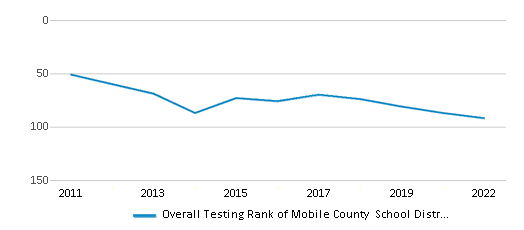
Mobile County School District, which is ranked within the bottom 50% of all 145 school districts in Alabama (based off of combined math and reading proficiency testing data) for the 2021-2022 school year.
The school district's graduation rate of 83% has stayed relatively flat over five school years.
Overall District Rank
#92 out of 145 school districts
(Bottom 50%)
(Bottom 50%)
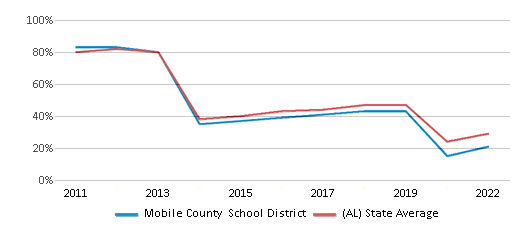
Math Test Scores (% Proficient)
21%
29%
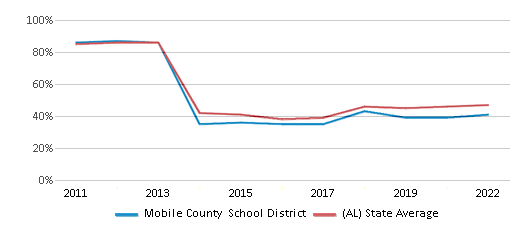
Reading/Language Arts Test Scores (% Proficient)
41%
47%
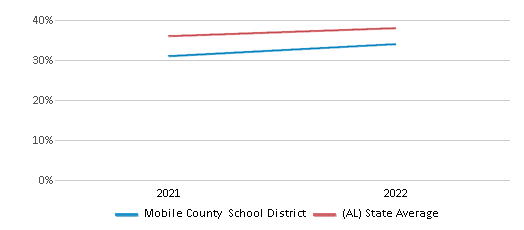
Science Test Scores (% Proficient)
34%
38%
Graduation Rate
83%
88%
Students by Ethnicity:
Diversity Score
0.62
0.61
# American Indian Students
515 Students
3,318 Students
% American Indian Students
1%
1%
# Asian Students
1,012 Students
3,771 Students
% Asian Students
2%
1%
# Hispanic Students
3,265 Students
27,927 Students
% Hispanic Students
7%
10%
# Black Students
25,621 Students
79,219 Students
% Black Students
50%
30%
# White Students
17,947 Students
146,785 Students
% White Students
35%
55%
# Hawaiian Students
47 Students
271 Students
% Hawaiian Students
n/a
n/a
# Two or more races Students
2,522 Students
7,990 Students
% of Two or more races Students
5%
3%
Students by Grade:
# Students in PK Grade:
1,557
1,653
# Students in K Grade:
3,885
3,203
# Students in 1st Grade:
4,216
3,312
# Students in 2nd Grade:
4,193
3,308
# Students in 3rd Grade:
3,870
3,300
# Students in 4th Grade:
3,857
3,240
# Students in 5th Grade:
3,777
3,663
# Students in 6th Grade:
3,706
5,852
# Students in 7th Grade:
3,694
10,681
# Students in 8th Grade:
3,666
12,552
# Students in 9th Grade:
4,077
59,097
# Students in 10th Grade:
3,788
56,985
# Students in 11th Grade:
3,417
53,180
# Students in 12th Grade:
3,226
49,255
# Ungraded Students:
-
-
District Revenue and Spending
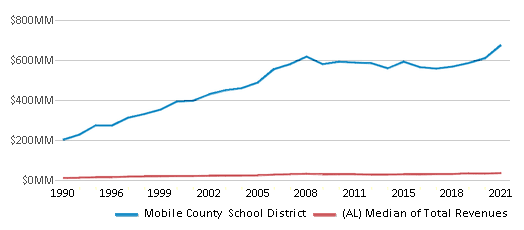
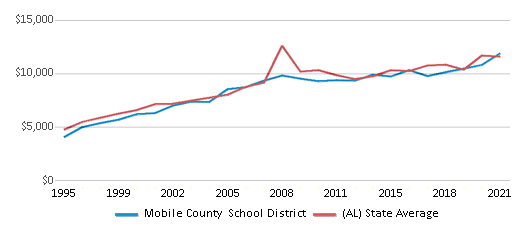
The revenue/student of $13,258 is higher than the state median of $13,006. The school district revenue/student has stayed relatively flat over four school years.
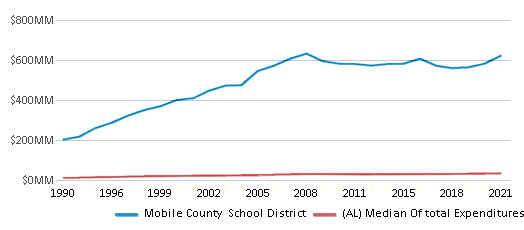
The school district's spending/student of $12,236 is higher than the state median of $12,220. The school district spending/student has stayed relatively flat over four school years.
Total Revenue
$675 MM
$9,671 MM
Spending
$623 MM
$9,086 MM
Revenue / Student
$13,258
$13,006
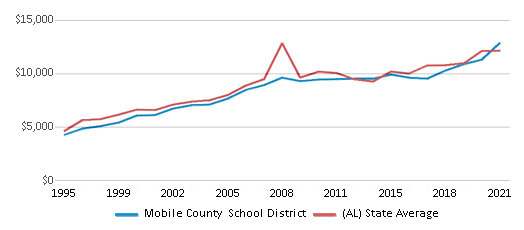
Spending / Student
$12,236
$12,220
Best Mobile County School District Public High Schools (2025)
School
(Math and Reading Proficiency)
(Math and Reading Proficiency)
Location
Grades
Students
Rank: #11.
Barton Academy For Advanced World Studies
Magnet School
(Math: 50-54% | Reading: 80-84%)
Rank:
Rank:
10/
Top 10%10
504 Government Street
Mobile, AL 36602
(251) 221-1040
Mobile, AL 36602
(251) 221-1040
Grades: 6-9
| 272 students
Rank: #22.
Wp Davidson High School
(Math: 36% | Reading: 42%)
Rank:
Rank:
7/
Top 50%10
3900 Pleasant Valley Rd
Mobile, AL 36609
(251) 221-3084
Mobile, AL 36609
(251) 221-3084
Grades: 9-12
| 1,473 students
Rank: #33.
Baker High School
(Math: 26% | Reading: 32%)
Rank:
Rank:
5/
Bottom 50%10
8901 Airport Blvd
Mobile, AL 36608
(251) 221-3000
Mobile, AL 36608
(251) 221-3000
Grades: 9-12
| 2,421 students
Rank: #44.
Mobile Mental Health Center
Special Education School
(Math: ≤20% | Reading: 21-39%)
Rank:
Rank:
4/
Bottom 50%10
5800 Southland Drive
Mobile, AL 36693
(251) 661-0153
Mobile, AL 36693
(251) 661-0153
Grades: K-12
| 46 students
Rank: #55.
Continuous Learning Center
Alternative School
(Math: ≤20% | Reading: ≤20%)
Rank:
Rank:
3/
Bottom 50%10
1870 Pleasant Ave
Mobile, AL 36617
(251) 221-2122
Mobile, AL 36617
(251) 221-2122
Grades: 9-12
| 302 students
Rank: #66.
Alma Bryant High School
(Math: 16% | Reading: 25%)
Rank:
Rank:
3/
Bottom 50%10
14001 Hurricane Blvd
Irvington, AL 36544
(251) 824-3213
Irvington, AL 36544
(251) 824-3213
Grades: 9-12
| 1,591 students
Rank: #77.
Mary G Montgomery High School
(Math: 15% | Reading: 25%)
Rank:
Rank:
3/
Bottom 50%10
4275 Snow Rd
Semmes, AL 36575
(251) 221-3153
Semmes, AL 36575
(251) 221-3153
Grades: 9-12
| 1,918 students
Rank: #88.
Citronelle High School
(Math: 15-19% | Reading: 15-19%)
Rank:
Rank:
3/
Bottom 50%10
8200 Lebaron Ave
Citronelle, AL 36522
(251) 221-3444
Citronelle, AL 36522
(251) 221-3444
Grades: 9-12
| 727 students
Rank: #99.
Murphy High School
(Math: 10% | Reading: 24%)
Rank:
Rank:
2/
Bottom 50%10
100 S Carlen St
Mobile, AL 36606
(251) 221-3184
Mobile, AL 36606
(251) 221-3184
Grades: 9-12
| 1,255 students
Rank: #1010.
Theodore High School
(Math: 10% | Reading: 17%)
Rank:
Rank:
2/
Bottom 50%10
6201 Swedetown Rd
Theodore, AL 36582
(251) 221-3351
Theodore, AL 36582
(251) 221-3351
Grades: 9-12
| 1,234 students
Rank: #1111.
Evening Educational Options
Alternative School
(Math: 60-79% | Reading: 60-79% )
Rank:
Rank:
1/
Bottom 50%10
2051 Military Road
Mobile, AL 36605
(251) 221-3233
Mobile, AL 36605
(251) 221-3233
Grades: 10-12
| 38 students
Rank: #12 - 1412. - 14.
Ben C Rain High School
(Math: ≤5% | Reading: 6-9%)
Rank:
Rank:
1/
Bottom 50%10
3125 Dauphin Island Pkwy
Mobile, AL 36605
(251) 221-3233
Mobile, AL 36605
(251) 221-3233
Grades: 9-12
| 587 students
Rank: #12 - 1412. - 14.
Cf Vigor High School
(Math: ≤5% | Reading: 6-9%)
Rank:
Rank:
1/
Bottom 50%10
913 N Wilson Ave
Mobile, AL 36610
(251) 221-3045
Mobile, AL 36610
(251) 221-3045
Grades: 9-12
| 607 students
Rank: #12 - 1412. - 14.
John L Leflore Magnet School
Magnet School
(Math: ≤5% | Reading: 6-9%)
Rank:
Rank:
1/
Bottom 50%10
700 Donald St
Mobile, AL 36617
(251) 221-3125
Mobile, AL 36617
(251) 221-3125
Grades: 9-12
| 564 students
Rank: #1515.
Augusta Evans School
Special Education School
(Math: ≤5% | Reading: ≤5%)
Rank:
Rank:
1/
Bottom 50%10
6301 Biloxi Ave
Mobile, AL 36608
(251) 221-5400
Mobile, AL 36608
(251) 221-5400
Grades: PK-12
| 192 students
Rank: #1616.
Lillie B Williamson High School
(Math: 3% | Reading: 15%)
Rank:
Rank:
1/
Bottom 50%10
1567 E Dublin St
Mobile, AL 36605
(251) 221-3411
Mobile, AL 36605
(251) 221-3411
Grades: 6-12
| 996 students
Rank: #1717.
Mattie T Blount High School
(Math: 2% | Reading: 3%)
Rank:
Rank:
1/
Bottom 50%10
5450 Lott Road
Eight Mile, AL 36613
(251) 221-3070
Eight Mile, AL 36613
(251) 221-3070
Grades: 9-12
| 1,105 students
Rank: n/an/a
Citronelle Center For Advanced Technology
Vocational School
19325 Rowe Street
Citronelle, AL 36522
(251) 221-3444
Citronelle, AL 36522
(251) 221-3444
Grades: 9-12
| n/a students
Rank: n/an/a
George H Bryant Vocationalagricultural Center
Vocational School
8950 Padgett Switch Rd
Irvington, AL 36544
(251) 957-2845
Irvington, AL 36544
(251) 957-2845
Grades: 9-12
| n/a students
Rank: n/an/a
Tl Faulkner School
Vocational School
33 West Elm St
Mobile, AL 36610
(251) 221-5431
Mobile, AL 36610
(251) 221-5431
Grades: 9-12
| n/a students
Recent Articles

Year-Round Or Traditional Schedule?
Which is more appropriate for your child? A year-round attendance schedule or traditional schedule? We look at the pros and cons.

Why You Should Encourage Your Child to Join a Sports Team
Participating in team sports has a great many benefits for children, there is no doubt. In this article you will learn what those benefits are.

White Students are Now the Minority in U.S. Public Schools
Increasing birth rates among immigrant families from Asia and Central and South America, combined with lower birth rates among white families, means that for the first time in history, public school students in the United States are majority-minority. This shift in demographics poses difficulties for schools as they work to accommodate children of varying language abilities and socio-economic backgrounds.


