Top Rankings
Talladega County School District ranks among the top 20% of public school district in Alabama for:
Category
Attribute
Community Size
Largest student body (number of students) (Top 1%)
For the 2025 school year, there are 8 public preschools serving 3,960 students in Talladega County School District. This district's average pre testing ranking is 6/10, which is in the top 50% of public pre schools in Alabama.
Public Preschools in Talladega County School District have an average math proficiency score of 33% (versus the Alabama public pre school average of 31%), and reading proficiency score of 53% (versus the 49% statewide average).
Minority enrollment is 35% of the student body (majority Black), which is less than the Alabama public preschool average of 48% (majority Black).
Overview
This School District
This State (AL)
# Schools
18 Schools
648 Schools
# Students
7,157 Students
310,670 Students
# Teachers
389 Teachers
18,546 Teachers
Student : Teacher Ratio
18:1
18:1
District Rank
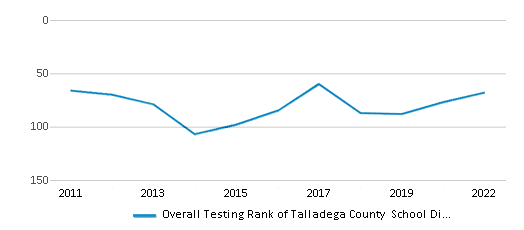
Talladega County School District, which is ranked within the top 50% of all 145 school districts in Alabama (based off of combined math and reading proficiency testing data) for the 2021-2022 school year.
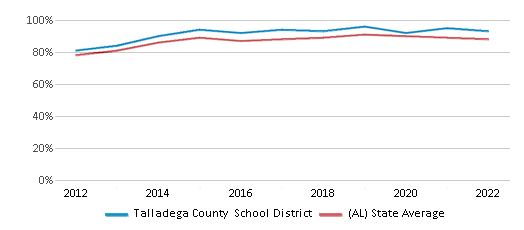
The school district's graduation rate of 93% has decreased from 94% over five school years.
Overall District Rank
#68 out of 145 school districts
(Top 50%)
(Top 50%)
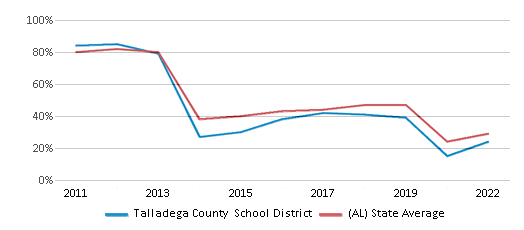
Math Test Scores (% Proficient)
24%
29%
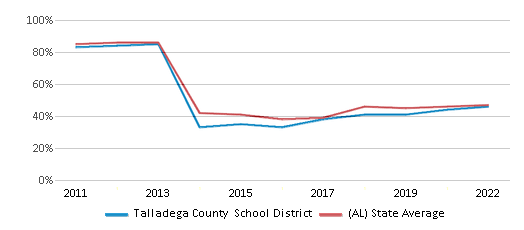
Reading/Language Arts Test Scores (% Proficient)
46%
47%
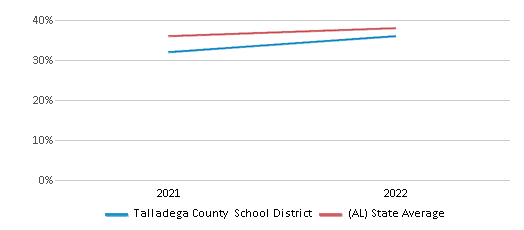
Science Test Scores (% Proficient)
36%
38%
Graduation Rate
93%
88%
Students by Ethnicity:
Diversity Score
0.53
0.63
# American Indian Students
10 Students
3,275 Students
% American Indian Students
n/a
1%
# Asian Students
22 Students
3,474 Students
% Asian Students
n/a
1%
# Hispanic Students
234 Students
33,026 Students
% Hispanic Students
3%
11%
# Black Students
2,293 Students
93,822 Students
% Black Students
32%
30%
# White Students
4,357 Students
162,634 Students
% White Students
61%
52%
# Hawaiian Students
1 Student
315 Students
% Hawaiian Students
n/a
n/a
# Two or more races Students
240 Students
14,124 Students
% of Two or more races Students
4%
5%
Students by Grade:
# Students in PK Grade:
325
21,304
# Students in K Grade:
569
49,720
# Students in 1st Grade:
542
50,373
# Students in 2nd Grade:
577
48,594
# Students in 3rd Grade:
553
40,410
# Students in 4th Grade:
506
36,751
# Students in 5th Grade:
480
31,378
# Students in 6th Grade:
523
12,553
# Students in 7th Grade:
518
4,421
# Students in 8th Grade:
506
4,401
# Students in 9th Grade:
560
2,950
# Students in 10th Grade:
584
2,768
# Students in 11th Grade:
470
2,555
# Students in 12th Grade:
444
2,492
# Ungraded Students:
-
-
District Revenue and Spending
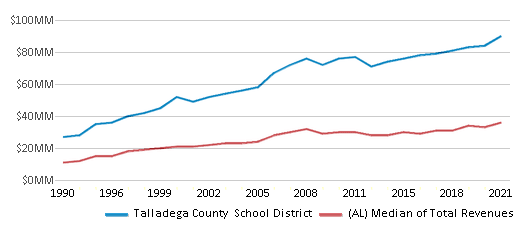
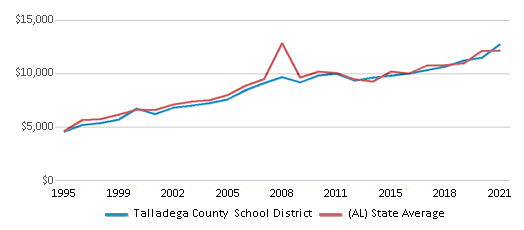
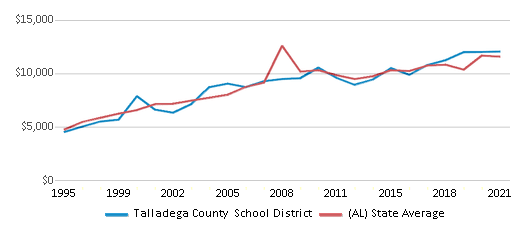
The revenue/student of $12,510 in this school district is less than the state median of $13,006. The school district revenue/student has stayed relatively flat over four school years.
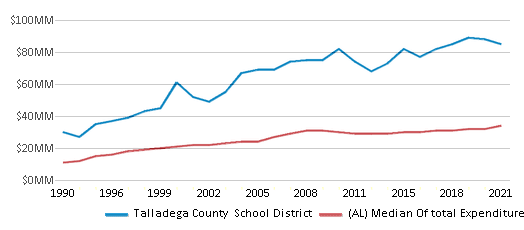
The school district's spending/student of $11,859 is less than the state median of $12,220. The school district spending/student has stayed relatively flat over four school years.
Total Revenue
$90 MM
$9,671 MM
Spending
$85 MM
$9,086 MM
Revenue / Student
$12,510
$13,006
Spending / Student
$11,859
$12,220
Best Talladega County School District Public Preschools (2025)
School
(Math and Reading Proficiency)
(Math and Reading Proficiency)
Location
Grades
Students
Rank: #11.
Fayetteville High School
(Math: 42% | Reading: 63%)
Rank:
Rank:
9/
Top 20%10
170 W W Averitte Dr
Sylacauga, AL 35151
(256) 315-5550
Sylacauga, AL 35151
(256) 315-5550
Grades: PK-12
| 578 students
Rank: #22.
Ah Watwood Elementary School
(Math: 45-49% | Reading: 55-59%)
Rank:
Rank:
9/
Top 20%10
3002 Limbaugh Blvd
Childersburg, AL 35044
(256) 315-5460
Childersburg, AL 35044
(256) 315-5460
Grades: PK-5
| 284 students
Rank: #33.
Lincoln Elementary School
(Math: 35% | Reading: 55%)
Rank:
Rank:
8/
Top 30%10
79001 Al Hwy 77
Lincoln, AL 35096
(256) 315-5265
Lincoln, AL 35096
(256) 315-5265
Grades: PK-5
| 899 students
Rank: #44.
Munford Elementary School
(Math: 33% | Reading: 54%)
Rank:
Rank:
8/
Top 30%10
365 Cedars Road
Munford, AL 36268
(256) 315-5250
Munford, AL 36268
(256) 315-5250
Grades: PK-5
| 748 students
Rank: #55.
Sycamore School
(Math: 30-34% | Reading: 50-54%)
Rank:
Rank:
7/
Top 50%10
22405 Al Highway 21
Alpine, AL 35014
(256) 315-5450
Alpine, AL 35014
(256) 315-5450
Grades: PK-5
| 309 students
Rank: #66.
Bb Comer Memorial Elementary School
(Math: 26% | Reading: 46%)
Rank:
Rank:
6/
Top 50%10
803 Seminole Ave
Sylacauga, AL 35150
(256) 315-5430
Sylacauga, AL 35150
(256) 315-5430
Grades: PK-6
| 509 students
Rank: #77.
Childersburg Elementary School
(Math: 20-24% | Reading: 40-44%)
Rank:
Rank:
6/
Top 50%10
235 Pinecrest Drive
Childersburg, AL 35044
(256) 315-5525
Childersburg, AL 35044
(256) 315-5525
Grades: PK-5
| 287 students
Rank: #88.
Stemley Road Elementary School
(Math: 15-19% | Reading: 35-39%)
Rank:
Rank:
5/
Bottom 50%10
2760 Stemley Bridge Rd
Talladega, AL 35160
(256) 315-5325
Talladega, AL 35160
(256) 315-5325
Grades: PK-6
| 346 students
Recent Articles

Year-Round Or Traditional Schedule?
Which is more appropriate for your child? A year-round attendance schedule or traditional schedule? We look at the pros and cons.

Why You Should Encourage Your Child to Join a Sports Team
Participating in team sports has a great many benefits for children, there is no doubt. In this article you will learn what those benefits are.

White Students are Now the Minority in U.S. Public Schools
Increasing birth rates among immigrant families from Asia and Central and South America, combined with lower birth rates among white families, means that for the first time in history, public school students in the United States are majority-minority. This shift in demographics poses difficulties for schools as they work to accommodate children of varying language abilities and socio-economic backgrounds.


