Top Rankings
Queen Creek Unified District (4245) School District ranks among the top 20% of public school district in Arizona for:
Category
Attribute
Overall Rank
Highest overall rank (Top 20%)
Math Proficiency
Highest math proficiency (Top 20%)
Graduation Rate
Highest graduation rate (Top 20%)
Community Size
Largest student body (number of students) (Top 1%)
For the 2025 school year, there are 15 public schools serving 14,503 students in Queen Creek Unified District (4245) School District. This district's average testing ranking is 9/10, which is in the top 20% of public schools in Arizona.
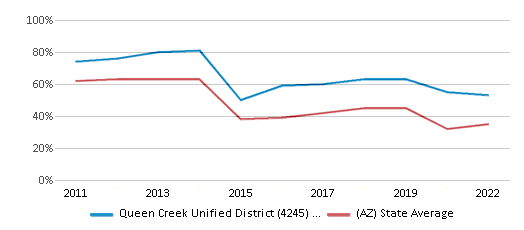
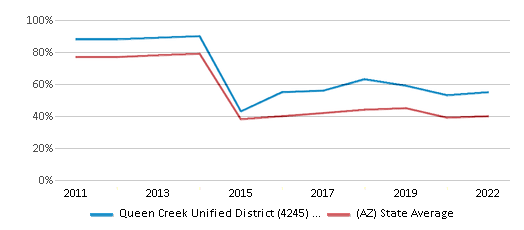
Public Schools in Queen Creek Unified District (4245) School District have an average math proficiency score of 53% (versus the Arizona public school average of 35%), and reading proficiency score of 55% (versus the 41% statewide average).
Minority enrollment is 36% of the student body (majority Hispanic), which is less than the Arizona public school average of 66% (majority Hispanic).
Overview
This School District
This State (AZ)
# Schools
15 Schools
2,476 Schools
# Students
14,503 Students
1,124,009 Students
# Teachers
725 Teachers
50,048 Teachers
Student : Teacher Ratio
20:1
20:1
District Rank
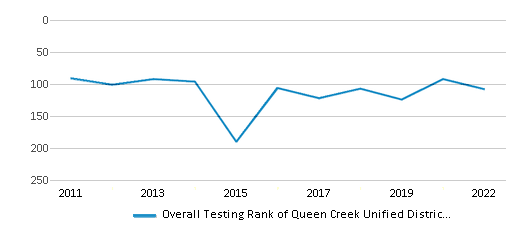
Queen Creek Unified District (4245) School District, which is ranked within the top 20% of all 607 school districts in Arizona (based off of combined math and reading proficiency testing data) for the 2021-2022 school year.
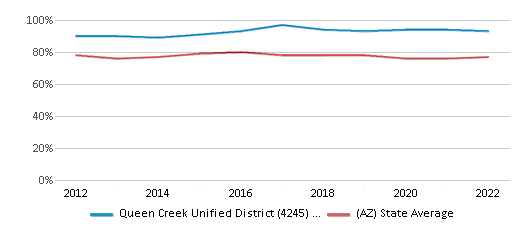
The school district's graduation rate of 93% has decreased from 97% over five school years.
Overall District Rank
#108 out of 631 school districts
(Top 20%)
(Top 20%)
Math Test Scores (% Proficient)
53%
35%
Reading/Language Arts Test Scores (% Proficient)
55%
40%
Science Test Scores (% Proficient)
32%
24%
Graduation Rate
93%
77%
Students by Ethnicity:
Diversity Score
0.53
0.66
# American Indian Students
99 Students
55,943 Students
% American Indian Students
1%
5%
# Asian Students
294 Students
35,951 Students
% Asian Students
2%
3%
# Hispanic Students
3,565 Students
537,792 Students
% Hispanic Students
25%
48%
# Black Students
444 Students
64,758 Students
% Black Students
3%
6%
# White Students
9,292 Students
377,234 Students
% White Students
64%
34%
# Hawaiian Students
57 Students
4,018 Students
% Hawaiian Students
n/a
n/a
# Two or more races Students
752 Students
48,280 Students
% of Two or more races Students
5%
4%
Students by Grade:
# Students in PK Grade:
682
20,586
# Students in K Grade:
968
73,171
# Students in 1st Grade:
984
78,842
# Students in 2nd Grade:
1,126
82,537
# Students in 3rd Grade:
1,041
80,342
# Students in 4th Grade:
1,072
82,920
# Students in 5th Grade:
993
83,092
# Students in 6th Grade:
1,005
83,167
# Students in 7th Grade:
1,180
84,224
# Students in 8th Grade:
1,072
85,183
# Students in 9th Grade:
1,242
89,727
# Students in 10th Grade:
1,167
92,689
# Students in 11th Grade:
1,077
90,220
# Students in 12th Grade:
894
96,766
# Ungraded Students:
-
543
District Revenue and Spending
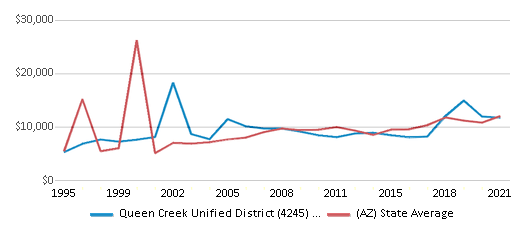
The revenue/student of $7,970 in this school district is less than the state median of $11,421. The school district revenue/student has declined by 31% over four school years.
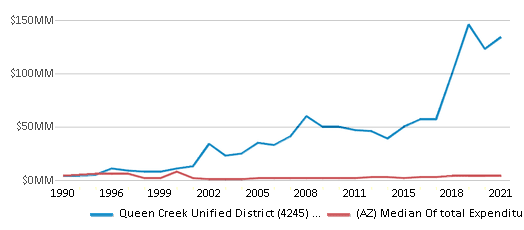
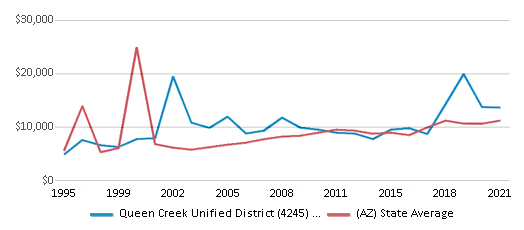
The school district's spending/student of $9,258 is less than the state median of $11,323. The school district spending/student has declined by 31% over four school years.
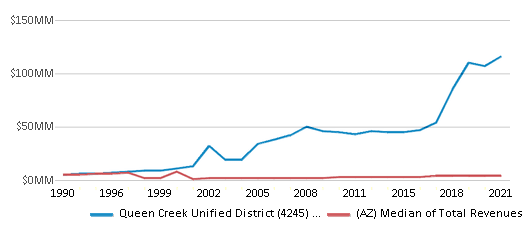
Total Revenue
$116 MM
$12,837 MM
Spending
$134 MM
$12,727 MM
Revenue / Student
$7,970
$11,421
Spending / Student
$9,258
$11,323
Best Queen Creek Unified District (4245) School District Public Schools (2025)
School
(Math and Reading Proficiency)
(Math and Reading Proficiency)
Location
Grades
Students
Rank: #11.
Katherine Mecham Barney Elementary School
(Math: 70-74% | Reading: 80-84%)
Rank:
Rank:
10/
Top 5%10
19684 S. 225th Pl
Queen Creek, AZ 85142
(480) 987-7490
Queen Creek, AZ 85142
(480) 987-7490
Grades: PK-6
| 819 students
Rank: #22.
Faith Mather Sossaman Elementary School
(Math: 71% | Reading: 65%)
Rank:
Rank:
10/
Top 10%10
22801 E Via Del Jardin
Queen Creek, AZ 85142
(480) 474-6900
Queen Creek, AZ 85142
(480) 474-6900
Grades: PK-6
| 1,163 students
Rank: #33.
Queen Creek High School
(Math: 65% | Reading: 67%)
Rank:
Rank:
10/
Top 10%10
22149 E Ocotillo Rd
Queen Creek, AZ 85142
(480) 987-5973
Queen Creek, AZ 85142
(480) 987-5973
Grades: 9-12
| 2,132 students
Rank: #44.
Frances Brandon-pickett Elementary School
(Math: 65% | Reading: 56%)
Rank:
Rank:
9/
Top 20%10
22706 East Village Loop Rd
Queen Creek, AZ 85142
(480) 987-7420
Queen Creek, AZ 85142
(480) 987-7420
Grades: PK-6
| 611 students
Rank: #55.
Desert Mountain Elementary School
(Math: 60% | Reading: 58%)
Rank:
Rank:
9/
Top 20%10
22301 S Hawes Rd
Queen Creek, AZ 85142
(480) 987-5912
Queen Creek, AZ 85142
(480) 987-5912
Grades: PK-6
| 740 students
Rank: #66.
Silver Valley Elementary School
(Math: 55% | Reading: 58%)
Rank:
Rank:
9/
Top 20%10
9737 E Toledo Ave
Mesa, AZ 85212
(480) 987-7443
Mesa, AZ 85212
(480) 987-7443
Grades: PK-6
| 1,330 students
Rank: #77.
Jack Barnes Elementary School
(Math: 56% | Reading: 55%)
Rank:
Rank:
9/
Top 20%10
20750 S 214th St
Queen Creek, AZ 85142
(480) 987-7400
Queen Creek, AZ 85142
(480) 987-7400
Grades: PK-6
| 630 students
Rank: #88.
Gateway Polytechnic Academy
(Math: 52% | Reading: 50%)
Rank:
Rank:
8/
Top 30%10
5149 S Signal Butte Rd
Mesa, AZ 85212
(480) 987-7440
Mesa, AZ 85212
(480) 987-7440
Grades: PK-8
| 983 students
Rank: #99.
Queen Creek Elementary School
(Math: 53% | Reading: 49%)
Rank:
Rank:
8/
Top 30%10
23636 S 204th St
Queen Creek, AZ 85142
(480) 987-5920
Queen Creek, AZ 85142
(480) 987-5920
Grades: PK-6
| 735 students
Rank: #1010.
Newell Barney College Preparatory School
(Math: 42% | Reading: 56%)
Rank:
Rank:
8/
Top 30%10
24937 S Sossaman Rd
Queen Creek, AZ 85142
(480) 474-6700
Queen Creek, AZ 85142
(480) 474-6700
Grades: 5-8
| 186 students
Rank: #1111.
Schnepf Elementary School
(Math: 48% | Reading: 51%)
Rank:
Rank:
8/
Top 30%10
23161 E Grange Pkwy
Queen Creek, AZ 85142
(480) 987-5935
Queen Creek, AZ 85142
(480) 987-5935
Grades: PK-6
| 840 students
Rank: #1212.
Queen Creek Junior High School
(Math: 45% | Reading: 50%)
Rank:
Rank:
8/
Top 30%10
20435 S Old Ellsworth Rd
Queen Creek, AZ 85142
(480) 987-5940
Queen Creek, AZ 85142
(480) 987-5940
Grades: 5-8
| 562 students
Rank: #1313.
Eastmark High School
(Math: 42% | Reading: 47%)
Rank:
Rank:
7/
Top 50%10
9560 E Ray Rd
Mesa, AZ 85212
(480) 474-6950
Mesa, AZ 85212
(480) 474-6950
Grades: 7-12
| 1,887 students
Rank: #1414.
Queen Creek Virtual Academy
(Math: 20-24% | Reading: 35-39%)
Rank:
Rank:
5/
Bottom 50%10
20217 E Chandler Heights Rd
Queen Creek, AZ 85142
(480) 987-5935
Queen Creek, AZ 85142
(480) 987-5935
Grades: K-12
| 239 students
Rank: n/an/a
21942 East Riggs Road
Queen Creek, AZ 85142
(480) 987-5583
Queen Creek, AZ 85142
(480) 987-5583
Grades: 7-11
| 1,646 students
Frequently Asked Questions
How many schools belong to Queen Creek Unified District (4245) School District?
Queen Creek Unified District (4245) School District manages 15 public schools serving 14,503 students.
What is the rank of Queen Creek Unified District (4245) School District?
Queen Creek Unified District (4245) School District is ranked #111 out of 607 school districts in Arizona (top 20%) based off of combined math and reading proficiency testing data for the 2021-2022 school year. This district ranks in the top 20% of Arizona school districts for: Highest overall rank (Top 20%), Highest math proficiency (Top 20%), Highest graduation rate (Top 20%) and Largest student body (number of students) (Top 1%)
What is the racial composition of students in Queen Creek Unified District (4245) School District?
64% of Queen Creek Unified District (4245) School District students are White, 25% of students are Hispanic, 5% of students are Two or more races, 3% of students are Black, 2% of students are Asian, and 1% of students are American Indian.
What is the student/teacher ratio of Queen Creek Unified District (4245) School District?
Queen Creek Unified District (4245) School District has a student/teacher ratio of 20:1, which is higher than the Arizona state average of 18:1.
What is Queen Creek Unified District (4245) School District's spending/student ratio?
The school district's spending/student of $9,258 is less than the state median of $11,323. The school district spending/student has declined by 31% over four school years.
Recent Articles

What Is A Charter School?
Explore the world of charter schools in this comprehensive guide. Learn about their history, how they operate, and the pros and cons of this educational innovation. Discover key facts about charter schools, including admission policies, demographics, and funding, as well as what to look for when considering a charter school for your child.

10 Reasons Why High School Sports Benefit Students
Discover the 10 compelling reasons why high school sports are beneficial for students. This comprehensive article explores how athletics enhance academic performance, foster personal growth, and develop crucial life skills. From improved fitness and time management to leadership development and community representation, learn why participating in high school sports can be a game-changer for students' overall success and well-being.

February 05, 2025
Understanding the U.S. Department of Education: Structure, Impact, and EvolutionWe explore how the Department of Education shapes American education, from its cabinet-level leadership to its impact on millions of students, written for general audiences seeking clarity on this vital institution.


