Top Rankings
Tucson Unified District (4403) School District ranks among the top 20% of public school district in Arizona for:
Category
Attribute
Community Size
Largest student body (number of students) (Top 1%)
For the 2025 school year, there are 39 public middle schools serving 26,186 students in Tucson Unified District (4403) School District. This district's average middle testing ranking is 4/10, which is in the bottom 50% of public middle schools in Arizona.
Public Middle Schools in Tucson Unified District (4403) School District have an average math proficiency score of 19% (versus the Arizona public middle school average of 33%), and reading proficiency score of 27% (versus the 40% statewide average).
Minority enrollment is 83% of the student body (majority Hispanic), which is more than the Arizona public middle school average of 65% (majority Hispanic).
Overview
This School District
This State (AZ)
# Schools
90 Schools
1,136 Schools
# Students
40,929 Students
601,819 Students
# Teachers
2,853 Teachers
23,710 Teachers
Student : Teacher Ratio
14:1
14:1
District Rank
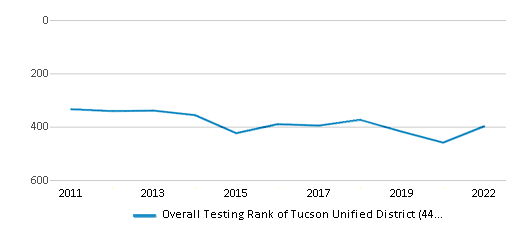
Tucson Unified District (4403) School District, which is ranked within the bottom 50% of all 607 school districts in Arizona (based off of combined math and reading proficiency testing data) for the 2021-2022 school year.
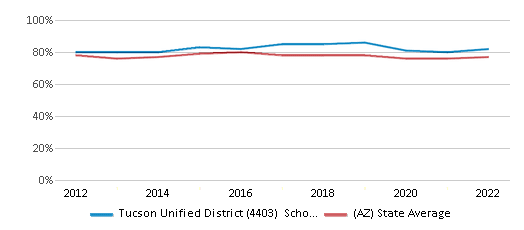
The school district's graduation rate of 82% has decreased from 85% over five school years.
Overall District Rank
#398 out of 631 school districts
(Bottom 50%)
(Bottom 50%)
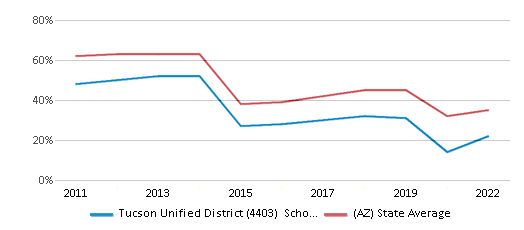
Math Test Scores (% Proficient)
22%
35%
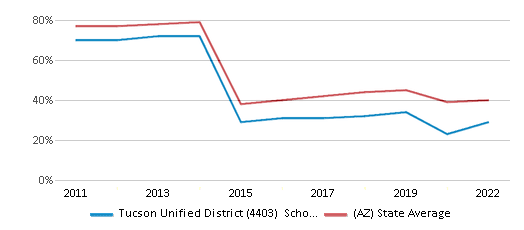
Reading/Language Arts Test Scores (% Proficient)
29%
40%
Science Test Scores (% Proficient)
15%
24%
Graduation Rate
82%
77%
Students by Ethnicity:
Diversity Score
0.54
0.66
# American Indian Students
1,513 Students
24,869 Students
% American Indian Students
4%
4%
# Asian Students
689 Students
22,000 Students
% Asian Students
2%
4%
# Hispanic Students
26,771 Students
274,625 Students
% Hispanic Students
65%
46%
# Black Students
2,725 Students
37,295 Students
% Black Students
7%
6%
# White Students
7,377 Students
213,598 Students
% White Students
18%
35%
# Hawaiian Students
216 Students
2,094 Students
% Hawaiian Students
n/a
n/a
# Two or more races Students
1,638 Students
27,338 Students
% of Two or more races Students
4%
5%
Students by Grade:
# Students in PK Grade:
1,255
6,008
# Students in K Grade:
2,735
32,719
# Students in 1st Grade:
2,917
35,076
# Students in 2nd Grade:
3,019
36,504
# Students in 3rd Grade:
2,867
36,347
# Students in 4th Grade:
3,008
38,172
# Students in 5th Grade:
3,068
41,445
# Students in 6th Grade:
2,674
59,688
# Students in 7th Grade:
2,830
84,224
# Students in 8th Grade:
2,809
85,183
# Students in 9th Grade:
3,578
36,231
# Students in 10th Grade:
3,524
36,652
# Students in 11th Grade:
3,283
35,943
# Students in 12th Grade:
3,313
37,463
# Ungraded Students:
49
164
District Revenue and Spending
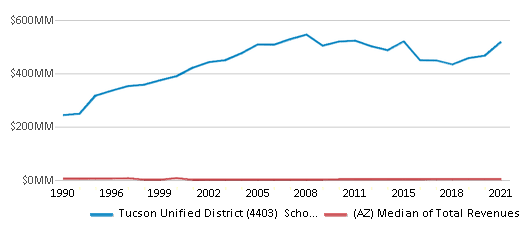
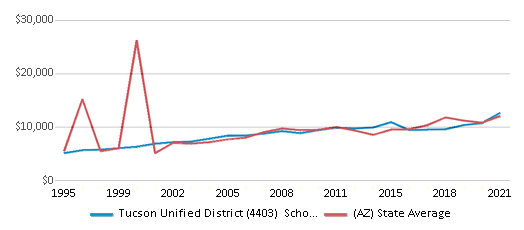
The revenue/student of $12,660 is higher than the state median of $11,421. The school district revenue/student has stayed relatively flat over four school years.
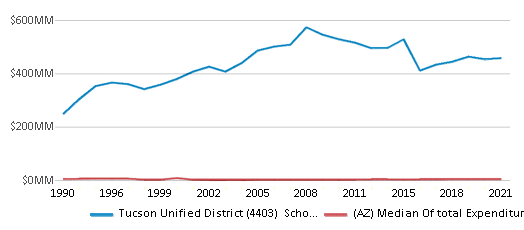
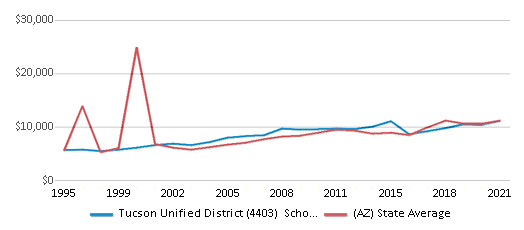
The school district's spending/student of $11,183 is less than the state median of $11,323. The school district spending/student has stayed relatively flat over four school years.
Total Revenue
$518 MM
$12,837 MM
Spending
$458 MM
$12,727 MM
Revenue / Student
$12,660
$11,421
Spending / Student
$11,183
$11,323
Best Tucson Unified District (4403) School District Public Middle Schools (2025)
School
(Math and Reading Proficiency)
(Math and Reading Proficiency)
Location
Grades
Students
Rank: #11.
University High School
(Math: ≥99% | Reading: 95%)
Rank:
Rank:
10/
Top 1%10
421 N Arcadia Ave
Tucson, AZ 85711
(520) 232-5900
Tucson, AZ 85711
(520) 232-5900
Grades: 8-12
| 1,001 students
Rank: #2 - 32. - 3.
Mary Meredith K-12 School
Special Education School
(Math: <50% | Reading: <50%)
Rank:
Rank:
8/
Top 30%10
755 N Magnolia Ave
Tucson, AZ 85711
(520) 232-8200
Tucson, AZ 85711
(520) 232-8200
Grades: K-12
| 25 students
Rank: #2 - 32. - 3.
Teenage Parent Program - Tapp
Alternative School
(Math: <50% | Reading: <50%)
Rank:
Rank:
8/
Top 30%10
102 N Plumer Ave
Tucson, AZ 85719
(520) 225-3250
Tucson, AZ 85719
(520) 225-3250
Grades: 6-12
| 21 students
Rank: #44.
Sabino High School
(Math: 45-49% | Reading: 45-49%)
Rank:
Rank:
7/
Top 50%10
5000 N Bowes Rd
Tucson, AZ 85749
(520) 584-7700
Tucson, AZ 85749
(520) 584-7700
Grades: 7-12
| 863 students
Rank: #55.
Borman K-8 School
(Math: 34% | Reading: 48%)
Rank:
Rank:
7/
Top 50%10
6630 E Lightning Dr
Tucson, AZ 85708
(520) 584-4600
Tucson, AZ 85708
(520) 584-4600
Grades: PK-8
| 457 students
Rank: #66.
Robins Elementary School
(Math: 38% | Reading: 41%)
Rank:
Rank:
7/
Top 50%10
3939 N Magnetite Ln
Tucson, AZ 85745
(520) 908-4300
Tucson, AZ 85745
(520) 908-4300
Grades: PK-8
| 473 students
Rank: #77.
Ida Flood Dodge Traditional Middle Magnet School
Magnet School
(Math: 30% | Reading: 42%)
Rank:
Rank:
6/
Top 50%10
5831 E Pima St
Tucson, AZ 85712
(520) 731-4100
Tucson, AZ 85712
(520) 731-4100
Grades: 6-8
| 410 students
Rank: #88.
Tucson Magnet High School
Magnet School
(Math: 33% | Reading: 38%)
Rank:
Rank:
6/
Top 50%10
400 N 2nd Ave
Tucson, AZ 85705
(520) 225-5000
Tucson, AZ 85705
(520) 225-5000
Grades: 8-12
| 3,039 students
Rank: #99.
Wakefield Middle School
(Math: 30-34% | Reading: 35-39%)
Rank:
Rank:
6/
Top 50%10
101 W 44th St
Tucson, AZ 85713
(520) 225-6280
Tucson, AZ 85713
(520) 225-6280
Grades: 6-8
| 269 students
Rank: #1010.
Palo Verde High Magnet School
Magnet School
(Math: 35-39% | Reading: 30-34%)
Rank:
Rank:
6/
Top 50%10
1302 S Avenida Vega
Tucson, AZ 85710
(520) 584-7400
Tucson, AZ 85710
(520) 584-7400
Grades: 8-12
| 676 students
Rank: #1111.
Tucson Unified Virtual Academy
(Math: 27% | Reading: 37%)
Rank:
Rank:
6/
Top 50%10
3645 E Pima St
Tucson, AZ 85716
(520) 232-8770
Tucson, AZ 85716
(520) 232-8770
Grades: K-12
| 1,237 students
Rank: #1212.
Sahuaro High School
(Math: 30% | Reading: 33%)
Rank:
Rank:
5/
Bottom 50%10
545 N Camino Seco
Tucson, AZ 85710
(520) 731-7100
Tucson, AZ 85710
(520) 731-7100
Grades: 8-12
| 1,386 students
Rank: #1313.
Rincon High School
(Math: 27% | Reading: 31%)
Rank:
Rank:
5/
Bottom 50%10
421 N Arcadia Ave
Tucson, AZ 85711
(520) 232-5600
Tucson, AZ 85711
(520) 232-5600
Grades: 8-12
| 1,217 students
Rank: #1414.
Mansfeld Middle Magnet School
Magnet School
(Math: 21% | Reading: 30%)
Rank:
Rank:
4/
Bottom 50%10
1300 E 6th St
Tucson, AZ 85719
(520) 225-1800
Tucson, AZ 85719
(520) 225-1800
Grades: 6-8
| 829 students
Rank: #1515.
Drachman Primary Magnet School
Magnet School
(Math: 20-24% | Reading: 25-29%)
Rank:
Rank:
4/
Bottom 50%10
1085 S 10th Ave
Tucson, AZ 85701
(520) 225-1500
Tucson, AZ 85701
(520) 225-1500
Grades: PK-8
| 308 students
Rank: #1616.
Gridley Middle School
(Math: 17% | Reading: 34%)
Rank:
Rank:
4/
Bottom 50%10
350 S Harrison Rd
Tucson, AZ 85748
(520) 731-4600
Tucson, AZ 85748
(520) 731-4600
Grades: 6-8
| 514 students
Rank: #1717.
Hollinger K-8 School
(Math: 20% | Reading: 27%)
Rank:
Rank:
4/
Bottom 50%10
150 W Ajo Way
Tucson, AZ 85713
(520) 225-1700
Tucson, AZ 85713
(520) 225-1700
Grades: PK-8
| 598 students
Rank: #1818.
Roskruge Bilingual Magnet Middle School
Magnet School
(Math: 17% | Reading: 29%)
Rank:
Rank:
4/
Bottom 50%10
501 E 6th St
Tucson, AZ 85705
(520) 225-2900
Tucson, AZ 85705
(520) 225-2900
Grades: PK-8
| 576 students
Rank: #1919.
Alice Vail Middle School
(Math: 14% | Reading: 33%)
Rank:
Rank:
4/
Bottom 50%10
5350 E 16th St
Tucson, AZ 85711
(520) 584-5400
Tucson, AZ 85711
(520) 584-5400
Grades: 6-8
| 573 students
Rank: #2020.
Magee Middle School
(Math: 17% | Reading: 28%)
Rank:
Rank:
4/
Bottom 50%10
8300 E Speedway Blvd
Tucson, AZ 85710
(520) 731-5000
Tucson, AZ 85710
(520) 731-5000
Grades: 6-8
| 303 students
Rank: #2121.
Miles-exploratory Learning Center
(Math: 15-19% | Reading: 25-29%)
Rank:
Rank:
4/
Bottom 50%10
1400 E Broadway Blvd
Tucson, AZ 85719
(520) 225-2200
Tucson, AZ 85719
(520) 225-2200
Grades: PK-8
| 297 students
Rank: #2222.
Santa Rita High School
(Math: 15-19% | Reading: 20-24%)
Rank:
Rank:
3/
Bottom 50%10
3951 S Pantano Rd
Tucson, AZ 85730
(520) 731-7500
Tucson, AZ 85730
(520) 731-7500
Grades: 8-12
| 333 students
Rank: #2323.
Doolen Middle School
(Math: 13% | Reading: 26%)
Rank:
Rank:
3/
Bottom 50%10
2400 N Country Club Rd
Tucson, AZ 85716
(520) 232-6900
Tucson, AZ 85716
(520) 232-6900
Grades: 6-8
| 482 students
Rank: #2424.
Pueblo High School
(Math: 16% | Reading: 23%)
Rank:
Rank:
3/
Bottom 50%10
3500 S 12th Ave
Tucson, AZ 85713
(520) 225-4300
Tucson, AZ 85713
(520) 225-4300
Grades: 8-12
| 1,806 students
Rank: #2525.
Cholla High School
(Math: 17% | Reading: 18%)
Rank:
Rank:
2/
Bottom 50%10
2001 W Starr Pass Blvd
Tucson, AZ 85713
(520) 225-4000
Tucson, AZ 85713
(520) 225-4000
Grades: 8-12
| 1,668 students
Rank: #2626.
Dietz K-8 School
(Math: 15% | Reading: 19%)
Rank:
Rank:
2/
Bottom 50%10
7575 E Palma St
Tucson, AZ 85710
(520) 731-4000
Tucson, AZ 85710
(520) 731-4000
Grades: PK-8
| 352 students
Rank: #2727.
Mccorkle Pk-8
(Math: 14% | Reading: 18%)
Rank:
Rank:
2/
Bottom 50%10
4455 S Mission Rd
Tucson, AZ 85746
(520) 877-2000
Tucson, AZ 85746
(520) 877-2000
Grades: PK-8
| 1,062 students
Rank: #2828.
Roberts Naylor
(Math: 13% | Reading: 19%)
Rank:
Rank:
2/
Bottom 50%10
1701 S Columbus Blvd
Tucson, AZ 85711
(520) 584-6800
Tucson, AZ 85711
(520) 584-6800
Grades: PK-8
| 611 students
Rank: #2929.
Secrist Middle School
(Math: 9% | Reading: 22%)
Rank:
Rank:
2/
Bottom 50%10
3400 S Houghton Rd
Tucson, AZ 85730
(520) 731-5300
Tucson, AZ 85730
(520) 731-5300
Grades: 6-8
| 250 students
Rank: #3030.
C E Rose Elementary School
(Math: 11% | Reading: 20%)
Rank:
Rank:
2/
Bottom 50%10
710 W Michigan St
Tucson, AZ 85714
(520) 908-4400
Tucson, AZ 85714
(520) 908-4400
Grades: PK-8
| 759 students
Rank: #3131.
Morgan Maxwell School
(Math: 10% | Reading: 19%)
Rank:
Rank:
2/
Bottom 50%10
2802 W Anklam Rd
Tucson, AZ 85745
(520) 225-2000
Tucson, AZ 85745
(520) 225-2000
Grades: PK-8
| 376 students
Rank: #3232.
Utterback Middle School
(Math: 11% | Reading: 17%)
Rank:
Rank:
2/
Bottom 50%10
3233 S Pinal Vis
Tucson, AZ 85713
(520) 225-3500
Tucson, AZ 85713
(520) 225-3500
Grades: 6-8
| 226 students
Rank: #3333.
Catalina High School
(Math: 10-14% | Reading: 10-14%)
Rank:
Rank:
1/
Bottom 50%10
3645 E Pima St
Tucson, AZ 85716
(520) 232-8400
Tucson, AZ 85716
(520) 232-8400
Grades: 8-12
| 614 students
Rank: #3434.
Booth-fickett Math/science Magnet School
Magnet School
(Math: 9% | Reading: 16%)
Rank:
Rank:
1/
Bottom 50%10
450 S Montego Dr
Tucson, AZ 85710
(520) 731-3800
Tucson, AZ 85710
(520) 731-3800
Grades: PK-8
| 366 students
Rank: #3535.
Pistor Middle School
(Math: 4% | Reading: 18%)
Rank:
Rank:
1/
Bottom 50%10
5455 S Cardinal Ave
Tucson, AZ 85746
(520) 908-5400
Tucson, AZ 85746
(520) 908-5400
Grades: 6-8
| 629 students
Show 4 more public schools in Tucson Unified District (4403) School District (out of 39 total schools)
Loading...
Recent Articles

What Is A Charter School?
Explore the world of charter schools in this comprehensive guide. Learn about their history, how they operate, and the pros and cons of this educational innovation. Discover key facts about charter schools, including admission policies, demographics, and funding, as well as what to look for when considering a charter school for your child.

10 Reasons Why High School Sports Benefit Students
Discover the 10 compelling reasons why high school sports are beneficial for students. This comprehensive article explores how athletics enhance academic performance, foster personal growth, and develop crucial life skills. From improved fitness and time management to leadership development and community representation, learn why participating in high school sports can be a game-changer for students' overall success and well-being.

February 05, 2025
Understanding the U.S. Department of Education: Structure, Impact, and EvolutionWe explore how the Department of Education shapes American education, from its cabinet-level leadership to its impact on millions of students, written for general audiences seeking clarity on this vital institution.


