Top Rankings
Burbank Unified School District ranks among the top 20% of public school district in California for:
Category
Attribute
Overall Rank
Highest overall rank (Top 20%)
Math Proficiency
Highest math proficiency (Top 20%)
Reading/Language Arts Proficiency
Highest reading/language arts proficiency (Top 20%)
Graduation Rate
Highest graduation rate (Top 5%)
Diversity
Most diverse schools (Top 1%)
Community Size
Largest student body (number of students) (Top 1%)
For the 2025 school year, there are 16 public elementary schools serving 9,260 students in Burbank Unified School District. This district's average elementary testing ranking is 9/10, which is in the top 20% of public elementary schools in California.
Public Elementary Schools in Burbank Unified School District have an average math proficiency score of 47% (versus the California public elementary school average of 35%), and reading proficiency score of 57% (versus the 45% statewide average).
Minority enrollment is 52% of the student body (majority Hispanic), which is less than the California public elementary school average of 79% (majority Hispanic).
Overview
This School District
This State (CA)
# Schools
21 Schools
7,700 Schools
# Students
14,208 Students
3,822,920 Students
# Teachers
615 Teachers
174,006 Teachers
Student : Teacher Ratio
23:1
23:1
District Rank
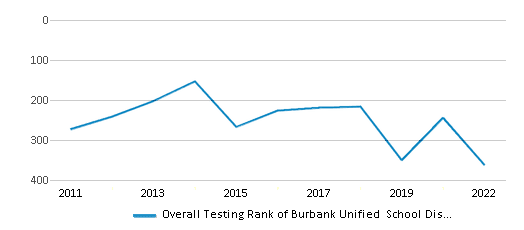
Burbank Unified School District, which is ranked #360 of all 1,925 school districts in California (based off of combined math and reading proficiency testing data) for the 2021-2022 school year.
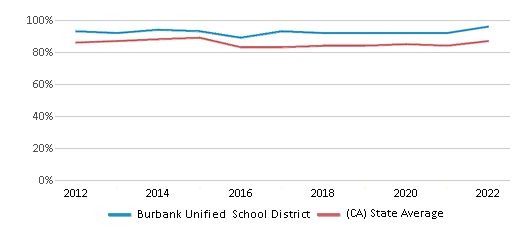
The school district's graduation rate of 96% has increased from 93% over five school years.
Overall District Rank
#362 out of 1941 school districts
(Top 20%)
(Top 20%)
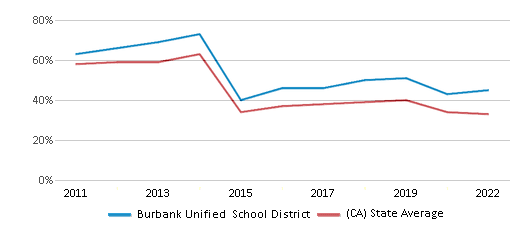
Math Test Scores (% Proficient)
45%
33%
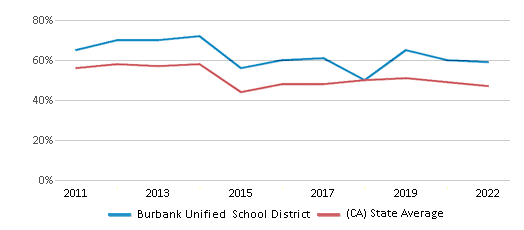
Reading/Language Arts Test Scores (% Proficient)
59%
47%
Science Test Scores (% Proficient)
40%
29%
Graduation Rate
96%
87%
Students by Ethnicity:
Diversity Score
0.66
0.64
# American Indian Students
19 Students
16,785 Students
% American Indian Students
n/a
1%
# Asian Students
1,178 Students
454,357 Students
% Asian Students
8%
12%
# Hispanic Students
4,462 Students
2,114,366 Students
% Hispanic Students
32%
55%
# Black Students
269 Students
189,461 Students
% Black Students
2%
5%
# White Students
6,903 Students
787,389 Students
% White Students
49%
21%
# Hawaiian Students
21 Students
15,077 Students
% Hawaiian Students
n/a
n/a
# Two or more races Students
1,332 Students
240,557 Students
% of Two or more races Students
9%
6%
Students by Grade:
# Students in PK Grade:
-
83
# Students in K Grade:
1,096
519,574
# Students in 1st Grade:
906
396,601
# Students in 2nd Grade:
978
414,466
# Students in 3rd Grade:
900
416,628
# Students in 4th Grade:
989
426,360
# Students in 5th Grade:
956
430,582
# Students in 6th Grade:
1,028
432,936
# Students in 7th Grade:
1,177
312,207
# Students in 8th Grade:
1,058
312,649
# Students in 9th Grade:
1,222
44,929
# Students in 10th Grade:
1,329
37,487
# Students in 11th Grade:
1,281
37,249
# Students in 12th Grade:
1,288
41,169
# Ungraded Students:
-
-
District Revenue and Spending
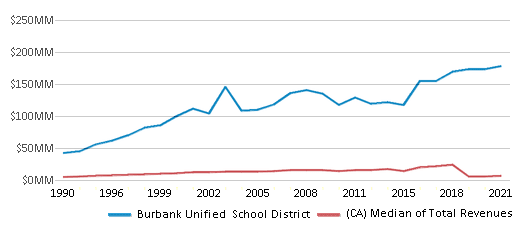
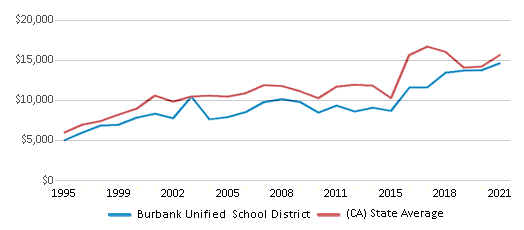
The revenue/student of $15,092 in this school district is less than the state median of $19,974. The school district revenue/student has stayed relatively flat over four school years.
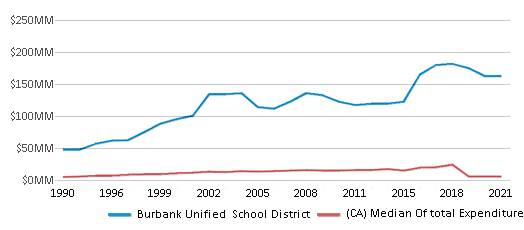
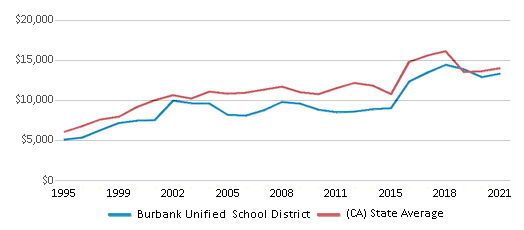
The school district's spending/student of $13,746 is less than the state median of $18,396. The school district spending/student has stayed relatively flat over four school years.
Total Revenue
$214 MM
$116,387 MM
Spending
$195 MM
$107,188 MM
Revenue / Student
$15,092
$19,974
Spending / Student
$13,746
$18,396
Best Burbank Unified School District Public Elementary Schools (2025)
School
(Math and Reading Proficiency)
(Math and Reading Proficiency)
Location
Grades
Students
Rank: #11.
Theodore Roosevelt Elementary School
(Math: 69% | Reading: 63%)
Rank:
Rank:
9/
Top 20%10
850 North Cordova St.
Burbank, CA 91505
(818) 729-3150
Burbank, CA 91505
(818) 729-3150
Grades: K-5
| 585 students
Rank: #22.
Thomas Jefferson Elementary School
(Math: 62% | Reading: 65%)
Rank:
Rank:
9/
Top 20%10
1900 North Sixth St.
Burbank, CA 91504
(818) 729-1600
Burbank, CA 91504
(818) 729-1600
Grades: K-5
| 749 students
Rank: #33.
Walt Disney Elementary School
(Math: 55-59% | Reading: 65-69%)
Rank:
Rank:
9/
Top 20%10
1220 West Orange Grove Ave.
Burbank, CA 91506
(818) 729-0100
Burbank, CA 91506
(818) 729-0100
Grades: K-5
| 402 students
Rank: #4 - 54. - 5.
R. L. Stevenson Elementary School
(Math: 58% | Reading: 65%)
Rank:
Rank:
9/
Top 20%10
3333 Oak St.
Burbank, CA 91505
(818) 729-5700
Burbank, CA 91505
(818) 729-5700
Grades: K-5
| 529 students
Rank: #4 - 54. - 5.
Thomas Edison Elementary School
(Math: 58% | Reading: 65%)
Rank:
Rank:
9/
Top 20%10
2110 West Chestnut St.
Burbank, CA 91506
(818) 729-0150
Burbank, CA 91506
(818) 729-0150
Grades: K-5
| 461 students
Rank: #66.
Bret Harte Elementary School
(Math: 51% | Reading: 66%)
Rank:
Rank:
9/
Top 20%10
3200 West Jeffries Ave.
Burbank, CA 91505
(818) 729-1250
Burbank, CA 91505
(818) 729-1250
Grades: K-5
| 537 students
Rank: #77.
Providencia Elementary School
(Math: 50-54% | Reading: 60-64%)
Rank:
Rank:
9/
Top 20%10
1919 North Ontario St.
Burbank, CA 91505
(818) 729-3100
Burbank, CA 91505
(818) 729-3100
Grades: K-5
| 403 students
Rank: #88.
Ralph Emerson Elementary School
(Math: 58% | Reading: 58%)
Rank:
Rank:
9/
Top 20%10
720 East Cypress Ave.
Burbank, CA 91501
(818) 729-1200
Burbank, CA 91501
(818) 729-1200
Grades: K-5
| 540 students
Rank: #99.
George Washington Elementary School
(Math: 50% | Reading: 55-59%)
Rank:
Rank:
8/
Top 30%10
2322 North Lincoln St.
Burbank, CA 91504
(818) 729-5750
Burbank, CA 91504
(818) 729-5750
Grades: K-5
| 431 students
Rank: #1010.
Joaquin Miller Elementary School
(Math: 51% | Reading: 54%)
Rank:
Rank:
8/
Top 30%10
720 East Providencia Ave.
Burbank, CA 91501
(818) 729-2050
Burbank, CA 91501
(818) 729-2050
Grades: K-5
| 748 students
Rank: #1111.
John Muir Middle School
(Math: 45% | Reading: 58%)
Rank:
Rank:
8/
Top 30%10
1111 North Kenneth Rd.
Burbank, CA 91504
(818) 729-3800
Burbank, CA 91504
(818) 729-3800
Grades: 6-8
| 1,362 students
Rank: #1212.
Magnolia Park
Special Education School
(Math: <50% | Reading: <50% )
Rank:
Rank:
7/
Top 50%10
1915 Monterey Ave.
Burbank, CA 91506
(818) 729-7650
Burbank, CA 91506
(818) 729-7650
Grades: 6-12
| 28 students
Rank: #1313.
Luther Burbank Middle School
(Math: 33% | Reading: 53%)
Rank:
Rank:
7/
Top 50%10
3700 West Jeffries Ave.
Burbank, CA 91505
(818) 729-3700
Burbank, CA 91505
(818) 729-3700
Grades: 6-8
| 967 students
Rank: #1414.
William Mckinley Elementary School
(Math: 39% | Reading: 49%)
Rank:
Rank:
7/
Top 50%10
349 West Valencia Ave.
Burbank, CA 91506
(818) 729-2000
Burbank, CA 91506
(818) 729-2000
Grades: K-5
| 440 students
Rank: #1515.
Dolores Huerta Middle School
(Math: 36% | Reading: 47%)
Rank:
Rank:
7/
Top 50%10
420 South Mariposa St.
Burbank, CA 91506
(818) 729-3900
Burbank, CA 91506
(818) 729-3900
Grades: 6-8
| 910 students
Rank: #1616.
Burbank Unified Independent Learning Academy (Buila)
Alternative School
(Math: 30-39% | Reading: 40-49%)
Rank:
Rank:
6/
Top 50%10
3715 Allan Ave.
Burbank, CA 91505
(818) 558-5353
Burbank, CA 91505
(818) 558-5353
Grades: 6-12
| 168 students
Recent Articles

Year-Round Or Traditional Schedule?
Which is more appropriate for your child? A year-round attendance schedule or traditional schedule? We look at the pros and cons.

Why You Should Encourage Your Child to Join a Sports Team
Participating in team sports has a great many benefits for children, there is no doubt. In this article you will learn what those benefits are.

White Students are Now the Minority in U.S. Public Schools
Increasing birth rates among immigrant families from Asia and Central and South America, combined with lower birth rates among white families, means that for the first time in history, public school students in the United States are majority-minority. This shift in demographics poses difficulties for schools as they work to accommodate children of varying language abilities and socio-economic backgrounds.


