Top Rankings
Jurupa Unified School District ranks among the top 20% of public school district in California for:
Category
Attribute
Community Size
Largest student body (number of students) (Top 1%)
For the 2025 school year, there are 25 public schools serving 17,946 students in Jurupa Unified School District. This district's average testing ranking is 2/10, which is in the bottom 50% of public schools in California.
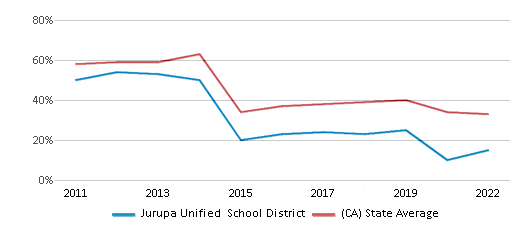
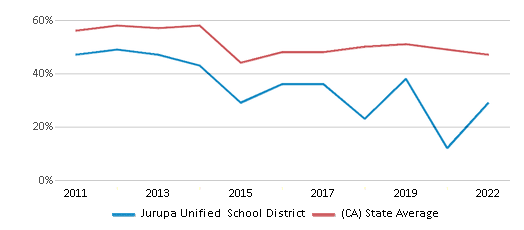
Public Schools in Jurupa Unified School District have an average math proficiency score of 15% (versus the California public school average of 33%), and reading proficiency score of 29% (versus the 47% statewide average).
Minority enrollment is 93% of the student body (majority Hispanic), which is more than the California public school average of 80% (majority Hispanic).
Overview
This School District
This State (CA)
# Schools
25 Schools
10,369 Schools
# Students
17,946 Students
5,826,838 Students
# Teachers
834 Teachers
268,018 Teachers
Student : Teacher Ratio
22:1
22:1
District Rank
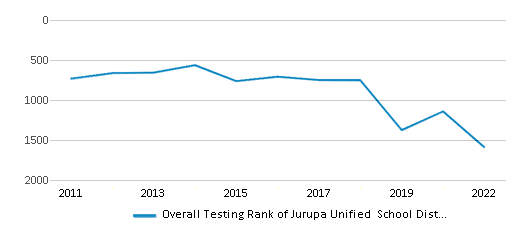
Jurupa Unified School District, which is ranked #1612 of all 1,925 school districts in California (based off of combined math and reading proficiency testing data) for the 2021-2022 school year.
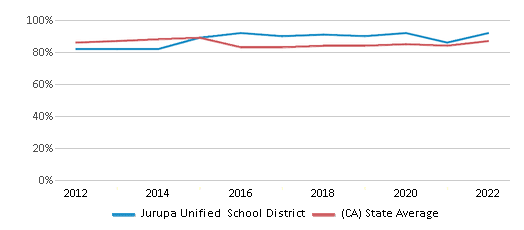
The school district's graduation rate of 92% has increased from 90% over five school years.
Overall District Rank
#1589 out of 1941 school districts
(Bottom 50%)
(Bottom 50%)
Math Test Scores (% Proficient)
15%
33%
Reading/Language Arts Test Scores (% Proficient)
29%
47%
Science Test Scores (% Proficient)
15%
29%
Graduation Rate
92%
87%
Students by Ethnicity:
Diversity Score
0.26
0.63
# American Indian Students
37 Students
25,796 Students
% American Indian Students
n/a
1%
# Asian Students
443 Students
705,807 Students
% Asian Students
3%
12%
# Hispanic Students
15,451 Students
3,264,561 Students
% Hispanic Students
86%
56%
# Black Students
373 Students
286,112 Students
% Black Students
2%
5%
# White Students
1,238 Students
1,178,558 Students
% White Students
7%
20%
# Hawaiian Students
37 Students
23,731 Students
% Hawaiian Students
n/a
n/a
# Two or more races Students
361 Students
333,755 Students
% of Two or more races Students
2%
6%
Students by Grade:
# Students in PK Grade:
-
83
# Students in K Grade:
1,578
522,456
# Students in 1st Grade:
1,267
396,605
# Students in 2nd Grade:
1,342
414,466
# Students in 3rd Grade:
1,350
416,628
# Students in 4th Grade:
1,273
426,361
# Students in 5th Grade:
1,393
430,587
# Students in 6th Grade:
1,338
432,997
# Students in 7th Grade:
1,391
439,621
# Students in 8th Grade:
1,355
441,777
# Students in 9th Grade:
1,351
466,534
# Students in 10th Grade:
1,380
476,585
# Students in 11th Grade:
1,407
469,511
# Students in 12th Grade:
1,521
492,627
# Ungraded Students:
-
-
District Revenue and Spending
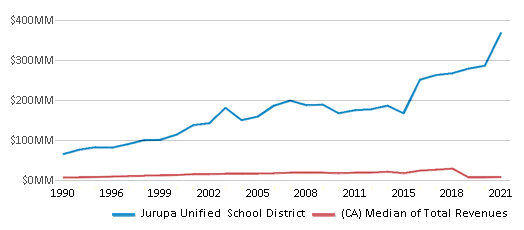
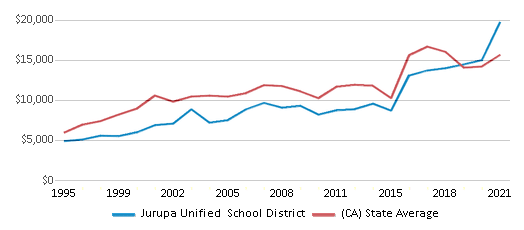
The revenue/student of $20,571 is higher than the state median of $19,974. The school district revenue/student has stayed relatively flat over four school years.
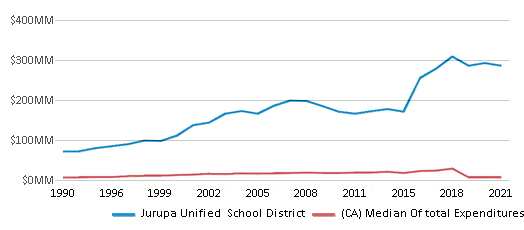
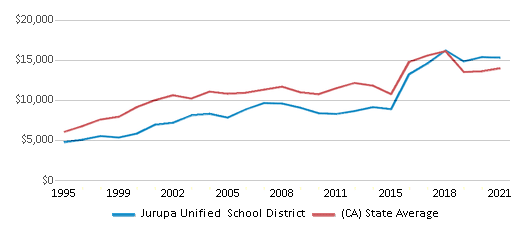
The school district's spending/student of $15,942 is less than the state median of $18,396. The school district spending/student has stayed relatively flat over four school years.
Total Revenue
$369 MM
$116,387 MM
Spending
$286 MM
$107,188 MM
Revenue / Student
$20,571
$19,974
Spending / Student
$15,942
$18,396
Best Jurupa Unified School District Public Schools (2025)
School
(Math and Reading Proficiency)
(Math and Reading Proficiency)
Location
Grades
Students
Rank: #11.
Camino Real Elementary School
(Math: 30% | Reading: 45%)
Rank:
Rank:
6/
Top 50%10
4655 Camino Real
Riverside, CA 92509
(951) 360-2714
Riverside, CA 92509
(951) 360-2714
Grades: K-6
| 738 students
Rank: #22.
Glen Avon Elementary School
(Math: 27% | Reading: 33%)
Rank:
Rank:
5/
Bottom 50%10
4352 Pyrite St.
Riverside, CA 92509
(951) 360-2764
Riverside, CA 92509
(951) 360-2764
Grades: K-6
| 519 students
Rank: #33.
Del Sol Academy
(Math: 25% | Reading: 35%)
Rank:
Rank:
5/
Bottom 50%10
11626 Forsythia St.
Mira Loma, CA 91752
(951) 416-1106
Mira Loma, CA 91752
(951) 416-1106
Grades: K-8
| 1,255 students
Rank: #44.
Jurupa Middle School
(Math: 17% | Reading: 39%)
Rank:
Rank:
4/
Bottom 50%10
8700 Galena St.
Riverside, CA 92509
(951) 360-2846
Riverside, CA 92509
(951) 360-2846
Grades: 7-8
| 1,130 students
Rank: #55.
Patriot High School
(Math: 13% | Reading: 44%)
Rank:
Rank:
4/
Bottom 50%10
4355 Camino Real
Riverside, CA 92509
(951) 361-6500
Riverside, CA 92509
(951) 361-6500
Grades: 9-12
| 2,482 students
Rank: #66.
Indian Hills Elementary School
(Math: 22% | Reading: 31%)
Rank:
Rank:
4/
Bottom 50%10
7750 Linares Ave.
Riverside, CA 92509
(951) 360-2724
Riverside, CA 92509
(951) 360-2724
Grades: K-6
| 442 students
Rank: #77.
Jurupa Valley High School
(Math: 10% | Reading: 45%)
Rank:
Rank:
4/
Bottom 50%10
10551 Bellegrave Ave.
Mira Loma, CA 91752
(951) 360-2600
Mira Loma, CA 91752
(951) 360-2600
Grades: 9-12
| 1,638 students
Rank: #88.
Sky Country Elementary School
(Math: 23% | Reading: 26%)
Rank:
Rank:
3/
Bottom 50%10
5520 Lucretia Ave.
Mira Loma, CA 91752
(951) 360-2816
Mira Loma, CA 91752
(951) 360-2816
Grades: K-6
| 475 students
Rank: #99.
Stone Avenue Elementary School
(Math: 19% | Reading: 31%)
Rank:
Rank:
3/
Bottom 50%10
5111 Stone Ave.
Riverside, CA 92509
(951) 360-2859
Riverside, CA 92509
(951) 360-2859
Grades: K-6
| 633 students
Rank: #1010.
Sunnyslope Elementary School
(Math: 20% | Reading: 26%)
Rank:
Rank:
3/
Bottom 50%10
7050 38th St.
Riverside, CA 92509
(951) 360-2781
Riverside, CA 92509
(951) 360-2781
Grades: K-6
| 820 students
Rank: #1111.
Granite Hill Elementary School
(Math: 13% | Reading: 30%)
Rank:
Rank:
3/
Bottom 50%10
9371 Granite Hill
Riverside, CA 92509
(951) 360-2725
Riverside, CA 92509
(951) 360-2725
Grades: K-6
| 381 students
Rank: #1212.
Peralta Elementary School
(Math: 17% | Reading: 23%)
Rank:
Rank:
3/
Bottom 50%10
6450 Peralta Pl.
Riverside, CA 92509
(951) 222-7701
Riverside, CA 92509
(951) 222-7701
Grades: K-6
| 473 students
Rank: #1313.
Pacific Avenue Academy Of Music
(Math: 15-19% | Reading: 20-24%)
Rank:
Rank:
2/
Bottom 50%10
6110 45th St.
Riverside, CA 92509
(951) 222-7877
Riverside, CA 92509
(951) 222-7877
Grades: K-6
| 315 students
Rank: #1414.
Mira Loma Middle School
(Math: 14% | Reading: 26%)
Rank:
Rank:
2/
Bottom 50%10
5051 Steve St.
Riverside, CA 92509
(951) 360-2883
Riverside, CA 92509
(951) 360-2883
Grades: 7-8
| 721 students
Rank: #1515.
Troth Street Elementary School
(Math: 16% | Reading: 21%)
Rank:
Rank:
2/
Bottom 50%10
5565 Troth St.
Mira Loma, CA 91752
(951) 360-2866
Mira Loma, CA 91752
(951) 360-2866
Grades: K-6
| 608 students
Rank: #1616.
Rustic Lane Elementary School
(Math: 16% | Reading: 20%)
Rank:
Rank:
2/
Bottom 50%10
6420 Rustic Ln.
Riverside, CA 92509
(951) 222-7837
Riverside, CA 92509
(951) 222-7837
Grades: K-6
| 540 students
Rank: #1717.
Rubidoux High School
(Math: 6% | Reading: 27%)
Rank:
Rank:
1/
Bottom 50%10
4250 Opal St.
Riverside, CA 92509
(951) 222-7700
Riverside, CA 92509
(951) 222-7700
Grades: 9-12
| 1,323 students
Rank: #1818.
Van Buren Elementary School
(Math: 10% | Reading: 20%)
Rank:
Rank:
1/
Bottom 50%10
9501 Jurupa Rd.
Riverside, CA 92509
(951) 360-2865
Riverside, CA 92509
(951) 360-2865
Grades: K-6
| 468 students
Rank: #1919.
Mission Bell Elementary School
(Math: 11% | Reading: 19%)
Rank:
Rank:
1/
Bottom 50%10
4020 Conning St.
Riverside, CA 92509
(951) 360-2748
Riverside, CA 92509
(951) 360-2748
Grades: K-6
| 367 students
Rank: #2020.
Mission Middle School
(Math: 7% | Reading: 23%)
Rank:
Rank:
1/
Bottom 50%10
5961 Mustang Ln.
Riverside, CA 92509
(951) 222-7842
Riverside, CA 92509
(951) 222-7842
Grades: 7-8
| 634 students
Rank: #2121.
Pedley Elementary School
(Math: 5% | Reading: 17%)
Rank:
Rank:
1/
Bottom 50%10
5871 Hudson St.
Riverside, CA 92509
(951) 360-2793
Riverside, CA 92509
(951) 360-2793
Grades: K-6
| 741 students
Rank: #2222.
West Riverside Elementary School
(Math: 5% | Reading: 15%)
Rank:
Rank:
1/
Bottom 50%10
3972 Riverview Dr.
Riverside, CA 92509
(951) 222-7759
Riverside, CA 92509
(951) 222-7759
Grades: K-6
| 639 students
Rank: #2323.
Ina Arbuckle Elementary School
(Math: 7% | Reading: 9%)
Rank:
Rank:
1/
Bottom 50%10
3600 Packard St.
Riverside, CA 92509
(951) 222-7788
Riverside, CA 92509
(951) 222-7788
Grades: K-6
| 388 students
Rank: #2424.
Nueva Vista Continuation High School
Alternative School
(Math: ≤5% | Reading: ≤5%)
Rank:
Rank:
1/
Bottom 50%10
6836 34th St.
Riverside, CA 92509
(951) 360-2802
Riverside, CA 92509
(951) 360-2802
Grades: 9-12
| 216 students
Rank: n/an/a
5960 Mustang Ln.
Riverside, CA 92509
(951) 222-7850
Riverside, CA 92509
(951) 222-7850
Grades: n/a
| n/a students
Frequently Asked Questions
How many schools belong to Jurupa Unified School District?
Jurupa Unified School District manages 25 public schools serving 17,946 students.
What is the rank of Jurupa Unified School District?
Jurupa Unified School District is ranked #1612 out of 1,925 school districts in California (bottom 50%) based off of combined math and reading proficiency testing data for the 2021-2022 school year. This district ranks in the top 20% of California school districts for: Largest student body (number of students) (Top 1%)
What is the racial composition of students in Jurupa Unified School District?
86% of Jurupa Unified School District students are Hispanic, 7% of students are White, 3% of students are Asian, 2% of students are Black, and 2% of students are Two or more races.
What is the student/teacher ratio of Jurupa Unified School District?
Jurupa Unified School District has a student/teacher ratio of 22:1, which is equal to the California state average of 22:1.
What is Jurupa Unified School District's spending/student ratio?
The school district's spending/student of $15,942 is less than the state median of $18,396. The school district spending/student has stayed relatively flat over four school years.
Recent Articles

Year-Round Or Traditional Schedule?
Which is more appropriate for your child? A year-round attendance schedule or traditional schedule? We look at the pros and cons.

Why You Should Encourage Your Child to Join a Sports Team
Participating in team sports has a great many benefits for children, there is no doubt. In this article you will learn what those benefits are.

White Students are Now the Minority in U.S. Public Schools
Increasing birth rates among immigrant families from Asia and Central and South America, combined with lower birth rates among white families, means that for the first time in history, public school students in the United States are majority-minority. This shift in demographics poses difficulties for schools as they work to accommodate children of varying language abilities and socio-economic backgrounds.


