For the 2025 school year, there are 5 public elementary schools serving 2,552 students in King City Union School District. This district's average elementary testing ranking is 2/10, which is in the bottom 50% of public elementary schools in California.
Public Elementary Schools in King City Union School District have an average math proficiency score of 14% (versus the California public elementary school average of 35%), and reading proficiency score of 25% (versus the 45% statewide average).
Minority enrollment is 97% of the student body (majority Hispanic), which is more than the California public elementary school average of 79% (majority Hispanic).
Overview
This School District
This State (CA)
# Schools
6 Schools
7,700 Schools
# Students
2,552 Students
3,822,920 Students
# Teachers
110 Teachers
174,006 Teachers
Student : Teacher Ratio
23:1
23:1
District Rank
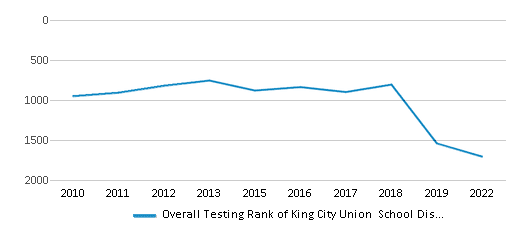
King City Union School District, which is ranked #1703 of all 1,925 school districts in California (based off of combined math and reading proficiency testing data) for the 2021-2022 school year.
Overall District Rank
#1707 out of 1941 school districts
(Bottom 50%)
(Bottom 50%)
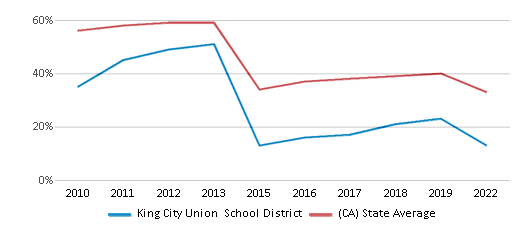
Math Test Scores (% Proficient)
13%
33%
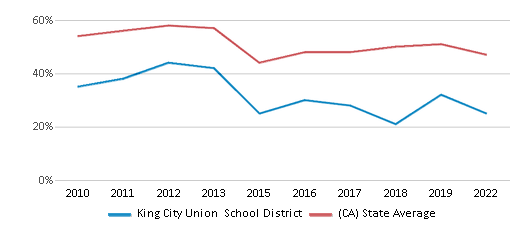
Reading/Language Arts Test Scores (% Proficient)
25%
47%
Science Test Scores (% Proficient)
12%
29%
Students by Ethnicity:
Diversity Score
0.10
0.64
# American Indian Students
1 Student
16,785 Students
% American Indian Students
n/a
1%
# Asian Students
39 Students
454,357 Students
% Asian Students
1%
12%
# Hispanic Students
2,425 Students
2,114,366 Students
% Hispanic Students
95%
55%
# Black Students
2 Students
189,461 Students
% Black Students
n/a
5%
# White Students
69 Students
787,389 Students
% White Students
3%
21%
# Hawaiian Students
n/a
15,077 Students
% Hawaiian Students
n/a
n/a
# Two or more races Students
16 Students
240,557 Students
% of Two or more races Students
1%
6%
Students by Grade:
# Students in PK Grade:
-
83
# Students in K Grade:
376
519,574
# Students in 1st Grade:
261
396,601
# Students in 2nd Grade:
260
414,466
# Students in 3rd Grade:
252
416,628
# Students in 4th Grade:
269
426,360
# Students in 5th Grade:
281
430,582
# Students in 6th Grade:
273
432,936
# Students in 7th Grade:
296
312,207
# Students in 8th Grade:
284
312,649
# Students in 9th Grade:
-
44,929
# Students in 10th Grade:
-
37,487
# Students in 11th Grade:
-
37,249
# Students in 12th Grade:
-
41,169
# Ungraded Students:
-
-
District Revenue and Spending
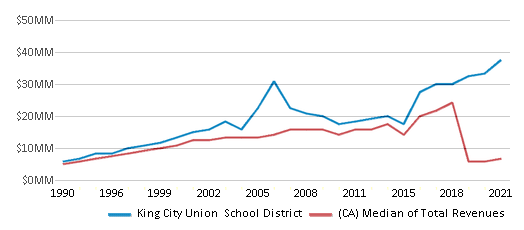
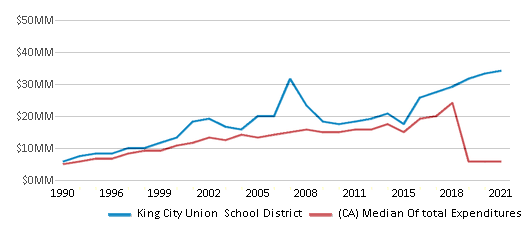
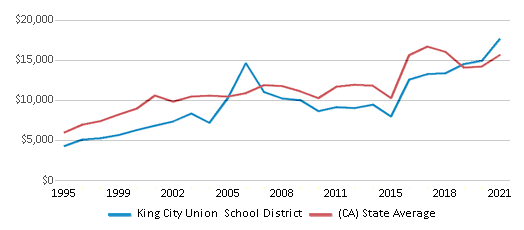
The revenue/student of $17,662 in this school district is less than the state median of $19,974. The school district revenue/student has stayed relatively flat over four school years.
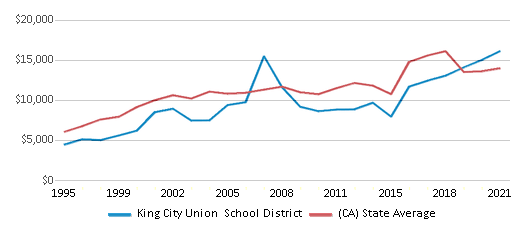
The school district's spending/student of $16,151 is less than the state median of $18,396. The school district spending/student has stayed relatively flat over four school years.
Total Revenue
$45 MM
$116,387 MM
Spending
$41 MM
$107,188 MM
Revenue / Student
$17,662
$19,974
Spending / Student
$16,151
$18,396
Best King City Union School District Public Elementary Schools (2025)
School
(Math and Reading Proficiency)
(Math and Reading Proficiency)
Location
Grades
Students
Rank: #11.
Phoenix Academy Community Day
Alternative School
(Math: <50% | Reading: <50%)
Rank:
Rank:
8/
Top 30%10
667 Meyer Ave.
King City, CA 93930
(831) 385-4400
King City, CA 93930
(831) 385-4400
Grades: 5-8
| n/a students
Rank: #22.
Del Rey Elementary School
(Math: 16% | Reading: 25%)
Rank:
Rank:
2/
Bottom 50%10
502 King St.
King City, CA 93930
(831) 385-4884
King City, CA 93930
(831) 385-4884
Grades: K-5
| 617 students
Rank: #33.
Chalone Peaks Middle School
(Math: 12% | Reading: 27%)
Rank:
Rank:
2/
Bottom 50%10
667 Meyer St.
King City, CA 93930
(831) 385-4400
King City, CA 93930
(831) 385-4400
Grades: 6-8
| 853 students
Rank: #44.
King City Arts Magnet
Magnet School
(Math: 15% | Reading: 23%)
Rank:
Rank:
2/
Bottom 50%10
415 Pearl St.
King City, CA 93930
(831) 385-5473
King City, CA 93930
(831) 385-5473
Grades: K-5
| 447 students
Rank: #55.
Santa Lucia Elementary School
(Math: 14% | Reading: 21%)
Rank:
Rank:
2/
Bottom 50%10
502 Collins St.
King City, CA 93930
(831) 385-3246
King City, CA 93930
(831) 385-3246
Grades: K-5
| 635 students
Recent Articles

Year-Round Or Traditional Schedule?
Which is more appropriate for your child? A year-round attendance schedule or traditional schedule? We look at the pros and cons.

Why You Should Encourage Your Child to Join a Sports Team
Participating in team sports has a great many benefits for children, there is no doubt. In this article you will learn what those benefits are.

White Students are Now the Minority in U.S. Public Schools
Increasing birth rates among immigrant families from Asia and Central and South America, combined with lower birth rates among white families, means that for the first time in history, public school students in the United States are majority-minority. This shift in demographics poses difficulties for schools as they work to accommodate children of varying language abilities and socio-economic backgrounds.


