Top Rankings
Roseville City Elementary School District ranks among the top 20% of public school district in California for:
Category
Attribute
Overall Rank
Highest overall rank (Top 20%)
Math Proficiency
Highest math proficiency (Top 20%)
Reading/Language Arts Proficiency
Highest reading/language arts proficiency (Top 20%)
Science Proficiency
Highest science proficiency (Top 20%)
Diversity
Most diverse schools (Top 1%)
Community Size
Largest student body (number of students) (Top 1%)
For the 2025 school year, there are 21 public elementary schools serving 11,985 students in Roseville City Elementary School District. This district's average elementary testing ranking is 9/10, which is in the top 20% of public elementary schools in California.
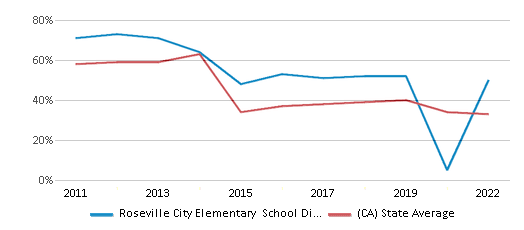
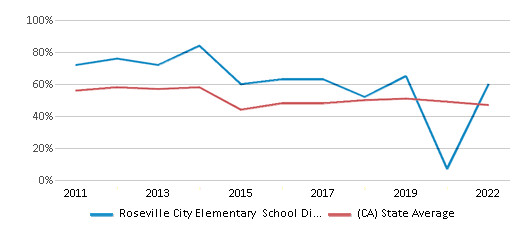
Public Elementary Schools in Roseville City Elementary School District have an average math proficiency score of 50% (versus the California public elementary school average of 35%), and reading proficiency score of 60% (versus the 45% statewide average).
Minority enrollment is 54% of the student body (majority Hispanic), which is less than the California public elementary school average of 79% (majority Hispanic).
Overview
This School District
This State (CA)
# Schools
21 Schools
7,700 Schools
# Students
11,985 Students
3,822,920 Students
# Teachers
552 Teachers
174,006 Teachers
Student : Teacher Ratio
22:1
22:1
District Rank
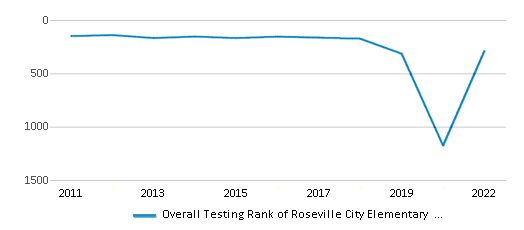
Roseville City Elementary School District, which is ranked #300 of all 1,925 school districts in California (based off of combined math and reading proficiency testing data) for the 2021-2022 school year.
Overall District Rank
#287 out of 1941 school districts
(Top 20%)
(Top 20%)
Math Test Scores (% Proficient)
50%
33%
Reading/Language Arts Test Scores (% Proficient)
60%
47%
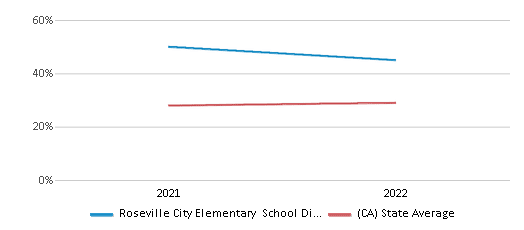
Science Test Scores (% Proficient)
45%
29%
Students by Ethnicity:
Diversity Score
0.70
0.64
# American Indian Students
32 Students
16,785 Students
% American Indian Students
n/a
1%
# Asian Students
1,864 Students
454,357 Students
% Asian Students
16%
12%
# Hispanic Students
2,976 Students
2,114,366 Students
% Hispanic Students
25%
55%
# Black Students
351 Students
189,461 Students
% Black Students
3%
5%
# White Students
5,512 Students
787,389 Students
% White Students
46%
21%
# Hawaiian Students
45 Students
15,077 Students
% Hawaiian Students
n/a
n/a
# Two or more races Students
1,204 Students
240,557 Students
% of Two or more races Students
10%
6%
Students by Grade:
# Students in PK Grade:
-
83
# Students in K Grade:
1,591
519,574
# Students in 1st Grade:
1,174
396,601
# Students in 2nd Grade:
1,254
414,466
# Students in 3rd Grade:
1,296
416,628
# Students in 4th Grade:
1,300
426,360
# Students in 5th Grade:
1,332
430,582
# Students in 6th Grade:
1,355
432,936
# Students in 7th Grade:
1,364
312,207
# Students in 8th Grade:
1,319
312,649
# Students in 9th Grade:
-
44,929
# Students in 10th Grade:
-
37,487
# Students in 11th Grade:
-
37,249
# Students in 12th Grade:
-
41,169
# Ungraded Students:
-
-
District Revenue and Spending
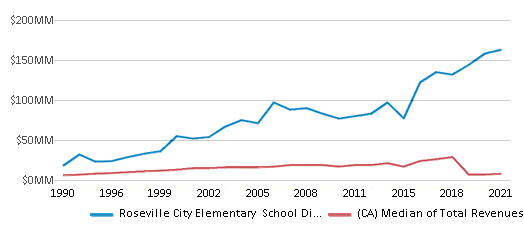
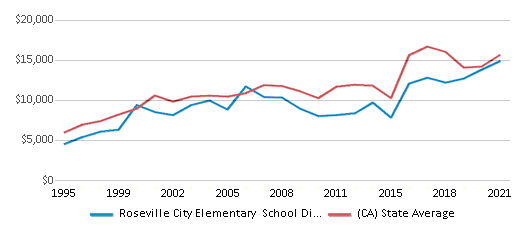
The revenue/student of $13,630 in this school district is less than the state median of $19,974. The school district revenue/student has declined by 8% over four school years.
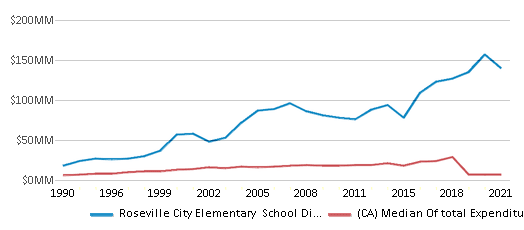
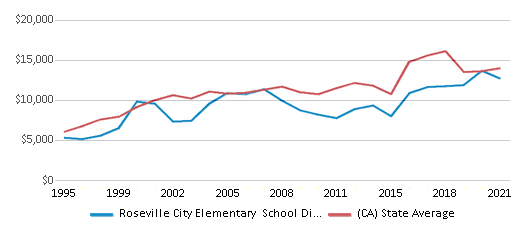
The school district's spending/student of $11,649 is less than the state median of $18,396. The school district spending/student has declined by 8% over four school years.
Total Revenue
$163 MM
$116,387 MM
Spending
$140 MM
$107,188 MM
Revenue / Student
$13,630
$19,974
Spending / Student
$11,649
$18,396
Best Roseville City Elementary School District Public Elementary Schools (2025)
School
(Math and Reading Proficiency)
(Math and Reading Proficiency)
Location
Grades
Students
Rank: #11.
Junction Elementary School
(Math: 67% | Reading: 74%)
Rank:
Rank:
10/
Top 10%10
2150 Ellison Dr.
Roseville, CA 95747
(916) 771-1860
Roseville, CA 95747
(916) 771-1860
Grades: K-5
| 625 students
Rank: #22.
Diamond Creek Elementary School
(Math: 70% | Reading: 72%)
Rank:
Rank:
10/
Top 10%10
3151 Hopscotch Way
Roseville, CA 95747
(916) 771-1760
Roseville, CA 95747
(916) 771-1760
Grades: K-5
| 566 students
Rank: #33.
Stoneridge Elementary School
(Math: 65% | Reading: 72%)
Rank:
Rank:
10/
Top 10%10
2501 Alexandra Dr.
Roseville, CA 95661
(916) 771-1830
Roseville, CA 95661
(916) 771-1830
Grades: K-5
| 481 students
Rank: #44.
Barbara Chilton Middle School
(Math: 55% | Reading: 74%)
Rank:
Rank:
9/
Top 20%10
4501 Bob Doyle Dr.
Roseville, CA 95747
(916) 771-1870
Roseville, CA 95747
(916) 771-1870
Grades: 6-8
| 1,209 students
Rank: #5 - 65. - 6.
Blue Oaks Elementary School
(Math: 61% | Reading: 66%)
Rank:
Rank:
9/
Top 20%10
8150 Horncastle Ave.
Roseville, CA 95747
(916) 771-1700
Roseville, CA 95747
(916) 771-1700
Grades: K-5
| 497 students
Rank: #5 - 65. - 6.
Orchard Ranch Elementary School
(Math: 61% | Reading: 66%)
Rank:
Rank:
9/
Top 20%10
4375 Brookstone Dr.
Roseville, CA 95747
(916) 771-1890
Roseville, CA 95747
(916) 771-1890
Grades: K-5
| 706 students
Rank: #77.
Thomas Jefferson Elementary School
(Math: 60-64% | Reading: 60-64%)
Rank:
Rank:
9/
Top 20%10
750 Central Park Dr.
Roseville, CA 95678
(916) 771-1840
Roseville, CA 95678
(916) 771-1840
Grades: K-5
| 331 students
Rank: #88.
Fiddyment Farm
(Math: 57% | Reading: 64%)
Rank:
Rank:
9/
Top 20%10
4001 Brick Mason Cir.
Roseville, CA 95747
(916) 771-1880
Roseville, CA 95747
(916) 771-1880
Grades: K-5
| 643 students
Rank: #99.
Robert C. Cooley Middle School
(Math: 52% | Reading: 63%)
Rank:
Rank:
9/
Top 20%10
9300 Prairie Woods Way
Roseville, CA 95747
(916) 771-1740
Roseville, CA 95747
(916) 771-1740
Grades: 6-8
| 997 students
Rank: #1010.
Catheryn Gates Elementary School
(Math: 54% | Reading: 58%)
Rank:
Rank:
9/
Top 20%10
1051 Trehowell Dr.
Roseville, CA 95678
(916) 771-1780
Roseville, CA 95678
(916) 771-1780
Grades: K-5
| 400 students
Rank: #11 - 1211. - 12.
Riego Creek Elementary School
(Math: 50-54% | Reading: 55-59%)
Rank:
Rank:
8/
Top 30%10
3255 Pruett Dr.
Roseville, CA 95747
(916) 771-1900
Roseville, CA 95747
(916) 771-1900
Grades: K-5
| 660 students
Rank: #11 - 1211. - 12.
Vencil Brown Elementary School
(Math: 50-54% | Reading: 55-59%)
Rank:
Rank:
8/
Top 30%10
250 Trestle Rd.
Roseville, CA 95678
(916) 771-1710
Roseville, CA 95678
(916) 771-1710
Grades: K-5
| 370 students
Rank: #1313.
William Kaseberg Elementary School
(Math: 40-44% | Reading: 55-59%)
Rank:
Rank:
8/
Top 30%10
1040 Main St.
Roseville, CA 95678
(916) 771-1790
Roseville, CA 95678
(916) 771-1790
Grades: K-5
| 292 students
Rank: #1414.
Crestmont Elementary School
(Math: 41% | Reading: 53%)
Rank:
Rank:
7/
Top 50%10
1501 Sheridan Ave.
Roseville, CA 95661
(916) 771-1750
Roseville, CA 95661
(916) 771-1750
Grades: K-5
| 424 students
Rank: #1515.
Warren T. Eich Middle School
(Math: 39% | Reading: 52%)
Rank:
Rank:
7/
Top 50%10
1509 Sierra Gardens Dr.
Roseville, CA 95661
(916) 771-1770
Roseville, CA 95661
(916) 771-1770
Grades: 6-8
| 960 students
Rank: #1616.
George Sargeant Elementary School
(Math: 39% | Reading: 45%)
Rank:
Rank:
7/
Top 50%10
1200 Ridgecrest Way
Roseville, CA 95661
(916) 771-1800
Roseville, CA 95661
(916) 771-1800
Grades: K-5
| 423 students
Rank: #1717.
George A. Buljan Middle School
(Math: 33% | Reading: 49%)
Rank:
Rank:
7/
Top 50%10
100 Hallissy Dr.
Roseville, CA 95678
(916) 771-1720
Roseville, CA 95678
(916) 771-1720
Grades: 6-8
| 872 students
Rank: #1818.
George Cirby Elementary School
(Math: 30-34% | Reading: 45-49%)
Rank:
Rank:
6/
Top 50%10
814 Darling Way
Roseville, CA 95678
(916) 771-1730
Roseville, CA 95678
(916) 771-1730
Grades: K-5
| 371 students
Rank: #1919.
Ferris Spanger Elementary School
(Math: 30-34% | Reading: 35-39%)
Rank:
Rank:
6/
Top 50%10
699 Shasta St.
Roseville, CA 95678
(916) 771-1820
Roseville, CA 95678
(916) 771-1820
Grades: K-5
| 305 students
Rank: #2020.
Bradford Woodbridge Fundamental Elementary School
(Math: 20-24% | Reading: 25-29%)
Rank:
Rank:
4/
Bottom 50%10
515 Niles Ave.
Roseville, CA 95678
(916) 771-1850
Roseville, CA 95678
(916) 771-1850
Grades: K-5
| 307 students
Rank: n/an/a
4501 Solaire Dr.
Roseville, CA 95747
(916) 771-1600
Roseville, CA 95747
(916) 771-1600
Grades: K-5
| 546 students
Recent Articles

Year-Round Or Traditional Schedule?
Which is more appropriate for your child? A year-round attendance schedule or traditional schedule? We look at the pros and cons.

Why You Should Encourage Your Child to Join a Sports Team
Participating in team sports has a great many benefits for children, there is no doubt. In this article you will learn what those benefits are.

White Students are Now the Minority in U.S. Public Schools
Increasing birth rates among immigrant families from Asia and Central and South America, combined with lower birth rates among white families, means that for the first time in history, public school students in the United States are majority-minority. This shift in demographics poses difficulties for schools as they work to accommodate children of varying language abilities and socio-economic backgrounds.


