Top Rankings
San Francisco Unified School District ranks among the top 20% of public school district in California for:
Category
Attribute
Math Proficiency
Highest math proficiency (Top 20%)
Diversity
Most diverse schools (Top 1%)
Community Size
Largest student body (number of students) (Top 1%)
For the 2025 school year, there are 113 public schools serving 48,670 students in San Francisco Unified School District. This district's average testing ranking is 8/10, which is in the top 30% of public schools in California.
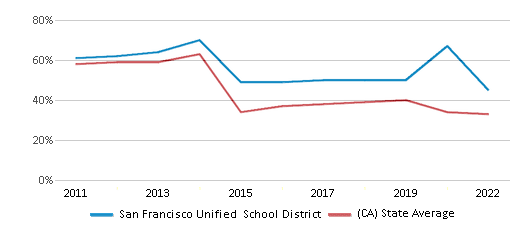
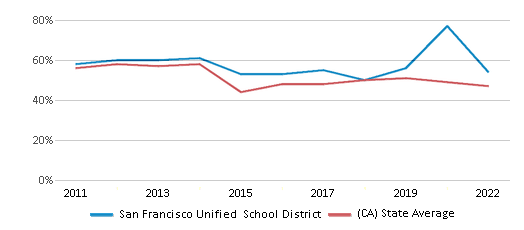
Public Schools in San Francisco Unified School District have an average math proficiency score of 45% (versus the California public school average of 33%), and reading proficiency score of 54% (versus the 47% statewide average).
Minority enrollment is 86% of the student body (majority Asian and Hispanic), which is more than the California public school average of 80% (majority Hispanic).
Overview
This School District
This State (CA)
# Schools
113 Schools
10,369 Schools
# Students
48,670 Students
5,826,838 Students
# Teachers
2,367 Teachers
268,018 Teachers
Student : Teacher Ratio
20:1
20:1
District Rank
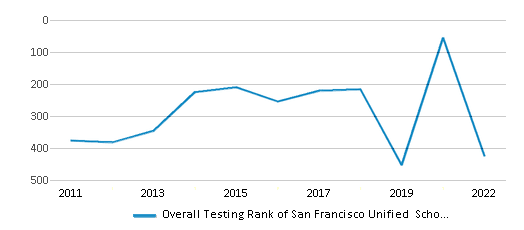
San Francisco Unified School District, which is ranked #451 of all 1,925 school districts in California (based off of combined math and reading proficiency testing data) for the 2021-2022 school year.
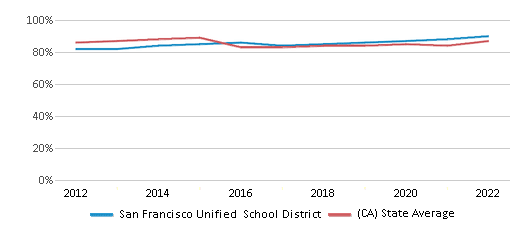
The school district's graduation rate of 90% has increased from 84% over five school years.
Overall District Rank
#425 out of 1941 school districts
(Top 30%)
(Top 30%)
Math Test Scores (% Proficient)
45%
33%
Reading/Language Arts Test Scores (% Proficient)
54%
47%
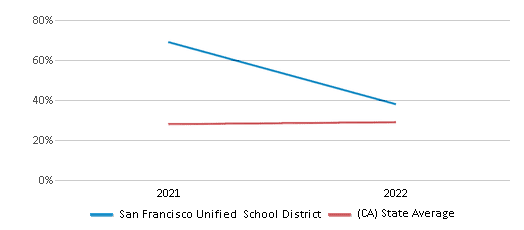
Science Test Scores (% Proficient)
38%
29%
Graduation Rate
90%
87%
Students by Ethnicity:
Diversity Score
0.74
0.63
# American Indian Students
86 Students
25,796 Students
% American Indian Students
n/a
1%
# Asian Students
17,292 Students
705,807 Students
% Asian Students
35%
12%
# Hispanic Students
15,638 Students
3,264,561 Students
% Hispanic Students
32%
56%
# Black Students
2,925 Students
286,112 Students
% Black Students
6%
5%
# White Students
6,587 Students
1,178,558 Students
% White Students
14%
20%
# Hawaiian Students
333 Students
23,731 Students
% Hawaiian Students
1%
n/a
# Two or more races Students
5,775 Students
333,755 Students
% of Two or more races Students
12%
6%
Students by Grade:
# Students in PK Grade:
-
83
# Students in K Grade:
4,499
522,456
# Students in 1st Grade:
3,818
396,605
# Students in 2nd Grade:
3,808
414,466
# Students in 3rd Grade:
3,810
416,628
# Students in 4th Grade:
3,778
426,361
# Students in 5th Grade:
3,740
430,587
# Students in 6th Grade:
3,297
432,997
# Students in 7th Grade:
3,385
439,621
# Students in 8th Grade:
3,266
441,777
# Students in 9th Grade:
3,630
466,534
# Students in 10th Grade:
3,894
476,585
# Students in 11th Grade:
3,915
469,511
# Students in 12th Grade:
3,830
492,627
# Ungraded Students:
-
-
District Revenue and Spending
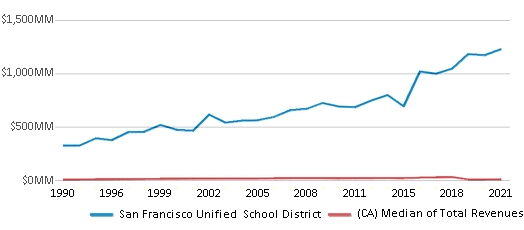
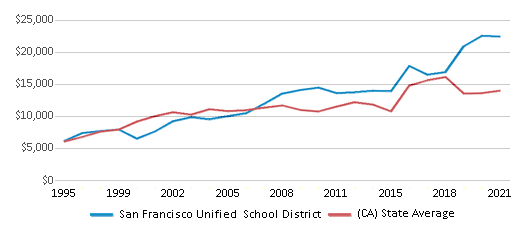
The revenue/student of $25,236 is higher than the state median of $19,974. The school district revenue/student has grown by 6% over four school years.
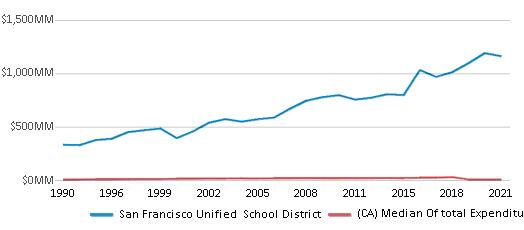
The school district's spending/student of $23,855 is higher than the state median of $18,396. The school district spending/student has grown by 6% over four school years.
Total Revenue
$1,228 MM
$116,387 MM
Spending
$1,161 MM
$107,188 MM
Revenue / Student
$25,236
$19,974
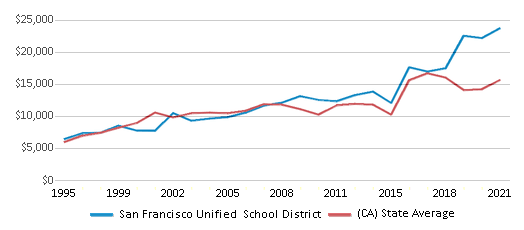
Spending / Student
$23,855
$18,396
Best San Francisco Unified School District Public Schools (2025)
School
(Math and Reading Proficiency)
(Math and Reading Proficiency)
Location
Grades
Students
Rank: #11.
Lowell High School
(Math: 85% | Reading: 96%)
Rank:
Rank:
10/
Top 1%10
1101 Eucalyptus Dr.
San Francisco, CA 94132
(415) 759-2730
San Francisco, CA 94132
(415) 759-2730
Grades: 9-12
| 2,540 students
Rank: #22.
Chinese Immersion School At Deavila
(Math: 85-89% | Reading: 80-84%)
Rank:
Rank:
10/
Top 5%10
1250 Waller St.
San Francisco, CA 94117
(415) 241-6325
San Francisco, CA 94117
(415) 241-6325
Grades: K-5
| 382 students
Rank: #33.
Sunset Elementary School
(Math: 80-84% | Reading: 80-84%)
Rank:
Rank:
10/
Top 5%10
1920 41st Ave.
San Francisco, CA 94116
(415) 759-2760
San Francisco, CA 94116
(415) 759-2760
Grades: K-5
| 403 students
Rank: #44.
Ulloa Elementary School
(Math: 81% | Reading: 81%)
Rank:
Rank:
10/
Top 5%10
2650 42nd Ave.
San Francisco, CA 94116
(415) 759-2841
San Francisco, CA 94116
(415) 759-2841
Grades: K-5
| 521 students
Rank: #55.
Lilienthal (Claire) Elementary School
(Math: 77% | Reading: 81%)
Rank:
Rank:
10/
Top 5%10
3630 Divisadero St.
San Francisco, CA 94123
(415) 749-3516
San Francisco, CA 94123
(415) 749-3516
Grades: K-8
| 670 students
Rank: #6 - 76. - 7.
Chin (John Yehall) Elementary School
(Math: 75-79% | Reading: 75-79%)
Rank:
Rank:
10/
Top 5%10
350 Broadway St.
San Francisco, CA 94133
(415) 291-7946
San Francisco, CA 94133
(415) 291-7946
Grades: K-5
| 253 students
Rank: #6 - 76. - 7.
Peabody (George) Elementary School
(Math: 75-79% | Reading: 75-79%)
Rank:
Rank:
10/
Top 5%10
251 Sixth Ave.
San Francisco, CA 94118
(415) 750-8480
San Francisco, CA 94118
(415) 750-8480
Grades: K-5
| 270 students
Rank: #88.
Asawa (Ruth) Sf Sch Of The Arts A Public School
Alternative School
(Math: 60-64% | Reading: 85-89%)
Rank:
Rank:
10/
Top 10%10
555 Portola Dr.
San Francisco, CA 94131
(415) 695-5700
San Francisco, CA 94131
(415) 695-5700
Grades: 9-12
| 680 students
Rank: #99.
Clarendon Alternative Elementary School
(Math: 70% | Reading: 79%)
Rank:
Rank:
10/
Top 10%10
500 Clarendon Ave.
San Francisco, CA 94131
(415) 759-2796
San Francisco, CA 94131
(415) 759-2796
Grades: K-5
| 529 students
Rank: #1010.
Stevenson (Robert Louis) Elementary School
(Math: 73% | Reading: 76%)
Rank:
Rank:
10/
Top 10%10
2051 34th Ave.
San Francisco, CA 94116
(415) 759-2837
San Francisco, CA 94116
(415) 759-2837
Grades: K-5
| 438 students
Rank: #1111.
Lafayette Elementary School
(Math: 74% | Reading: 75%)
Rank:
Rank:
10/
Top 10%10
4545 Anza St.
San Francisco, CA 94121
(415) 750-8483
San Francisco, CA 94121
(415) 750-8483
Grades: K-5
| 474 students
Rank: #1212.
Grattan Elementary School
(Math: 75-79% | Reading: 70-74%)
Rank:
Rank:
10/
Top 10%10
165 Grattan St.
San Francisco, CA 94117
(415) 759-2815
San Francisco, CA 94117
(415) 759-2815
Grades: K-5
| 384 students
Rank: #1313.
Yu (Alice Fong) Elementary School
(Math: 70% | Reading: 76%)
Rank:
Rank:
10/
Top 10%10
1541 12th Ave.
San Francisco, CA 94122
(415) 759-2764
San Francisco, CA 94122
(415) 759-2764
Grades: K-8
| 589 students
Rank: #1414.
New Traditions Elementary School
(Math: 65-69% | Reading: 75-79%)
Rank:
Rank:
10/
Top 10%10
2049 Grove St.
San Francisco, CA 94117
(415) 750-8490
San Francisco, CA 94117
(415) 750-8490
Grades: K-5
| 254 students
Rank: #15 - 1615. - 16.
Sloat (Commodore) Elementary School
(Math: 70-74% | Reading: 70-74%)
Rank:
Rank:
10/
Top 10%10
50 Darien Way
San Francisco, CA 94127
(415) 759-2807
San Francisco, CA 94127
(415) 759-2807
Grades: K-5
| 381 students
Rank: #15 - 1615. - 16.
Yick Wo Elementary School
(Math: 70-74% | Reading: 70-74%)
Rank:
Rank:
10/
Top 10%10
2245 Jones St.
San Francisco, CA 94133
(415) 749-3540
San Francisco, CA 94133
(415) 749-3540
Grades: K-5
| 199 students
Rank: #1717.
Lawton Alternative
(Math: 66% | Reading: 76%)
Rank:
Rank:
10/
Top 10%10
1570 31st Ave.
San Francisco, CA 94122
(415) 759-2832
San Francisco, CA 94122
(415) 759-2832
Grades: K-8
| 601 students
Rank: #18 - 1918. - 19.
Argonne Elementary School
(Math: 70-74% | Reading: 65-69%)
Rank:
Rank:
10/
Top 10%10
680 18th Ave.
San Francisco, CA 94121
(415) 750-8460
San Francisco, CA 94121
(415) 750-8460
Grades: K-5
| 368 students
Rank: #18 - 1918. - 19.
Ortega (Jose) Elementary School
(Math: 70-74% | Reading: 65-69%)
Rank:
Rank:
10/
Top 10%10
400 Sargent St.
San Francisco, CA 94132
(415) 469-4726
San Francisco, CA 94132
(415) 469-4726
Grades: K-5
| 374 students
Rank: #2020.
Milk (Harvey) Civil Rights Elementary School
(Math: 60-64% | Reading: 70-74%)
Rank:
Rank:
10/
Top 10%10
4235 19th St.
San Francisco, CA 94114
(415) 241-6276
San Francisco, CA 94114
(415) 241-6276
Grades: K-5
| 154 students
Rank: #2121.
Giannini (A.p.) Middle School
(Math: 60% | Reading: 74%)
Rank:
Rank:
9/
Top 20%10
3151 Ortega St.
San Francisco, CA 94122
(415) 759-2770
San Francisco, CA 94122
(415) 759-2770
Grades: 6-8
| 1,193 students
Rank: #22 - 2322. - 23.
Mccoppin (Frank) Elementary School
(Math: 65-69% | Reading: 65-69%)
Rank:
Rank:
9/
Top 20%10
651 Sixth Ave.
San Francisco, CA 94118
(415) 750-8475
San Francisco, CA 94118
(415) 750-8475
Grades: K-5
| 242 students
Rank: #22 - 2322. - 23.
Sutro Elementary School
(Math: 65-69% | Reading: 65-69%)
Rank:
Rank:
9/
Top 20%10
235 12th Ave.
San Francisco, CA 94118
(415) 750-8525
San Francisco, CA 94118
(415) 750-8525
Grades: K-5
| 248 students
Rank: #2424.
Jefferson Elementary School
(Math: 62% | Reading: 69%)
Rank:
Rank:
9/
Top 20%10
1725 Irving St.
San Francisco, CA 94122
(415) 759-2821
San Francisco, CA 94122
(415) 759-2821
Grades: K-5
| 502 students
Rank: #2525.
Key (Francis Scott) Elementary School
(Math: 66% | Reading: 67%)
Rank:
Rank:
9/
Top 20%10
1530 43rd Ave.
San Francisco, CA 94122
(415) 759-2811
San Francisco, CA 94122
(415) 759-2811
Grades: K-5
| 562 students
Rank: #2626.
West Portal Elementary School
(Math: 68% | Reading: 65%)
Rank:
Rank:
9/
Top 20%10
5 Lenox Way
San Francisco, CA 94127
(415) 759-2846
San Francisco, CA 94127
(415) 759-2846
Grades: K-5
| 590 students
Rank: #2727.
Mckinley Elementary School
(Math: 60-64% | Reading: 65-69%)
Rank:
Rank:
9/
Top 20%10
1025 14th St.
San Francisco, CA 94114
(415) 241-6300
San Francisco, CA 94114
(415) 241-6300
Grades: K-5
| 247 students
Rank: #2828.
Presidio Middle School
(Math: 57% | Reading: 70%)
Rank:
Rank:
9/
Top 20%10
450 30th Ave.
San Francisco, CA 94121
(415) 750-8435
San Francisco, CA 94121
(415) 750-8435
Grades: 6-8
| 980 students
Rank: #2929.
Alamo Elementary School
(Math: 63% | Reading: 66%)
Rank:
Rank:
9/
Top 20%10
250 23rd Ave.
San Francisco, CA 94121
(415) 750-8456
San Francisco, CA 94121
(415) 750-8456
Grades: K-5
| 393 students
Rank: #3030.
Washington (George) High School
(Math: 55% | Reading: 71%)
Rank:
Rank:
9/
Top 20%10
600 32nd Ave.
San Francisco, CA 94121
(415) 750-8400
San Francisco, CA 94121
(415) 750-8400
Grades: 9-12
| 2,008 students
Rank: #31 - 3231. - 32.
Feinstein (Dianne) Elementary School
(Math: 60-64% | Reading: 60-64%)
Rank:
Rank:
9/
Top 20%10
2550 25th Ave.
San Francisco, CA 94116
(415) 615-8460
San Francisco, CA 94116
(415) 615-8460
Grades: K-5
| 383 students
Rank: #31 - 3231. - 32.
Sunnyside Elementary School
(Math: 60-64% | Reading: 60-64%)
Rank:
Rank:
9/
Top 20%10
250 Foerster St.
San Francisco, CA 94112
(415) 469-4746
San Francisco, CA 94112
(415) 469-4746
Grades: K-5
| 350 students
Rank: #3333.
Roosevelt Middle School
(Math: 52% | Reading: 69%)
Rank:
Rank:
9/
Top 20%10
460 Arguello Blvd.
San Francisco, CA 94118
(415) 750-8446
San Francisco, CA 94118
(415) 750-8446
Grades: 6-8
| 657 students
Rank: #3434.
Lau (Gordon J.) Elementary School
(Math: 66% | Reading: 60%)
Rank:
Rank:
9/
Top 20%10
950 Clay St.
San Francisco, CA 94108
(415) 291-7921
San Francisco, CA 94108
(415) 291-7921
Grades: K-5
| 650 students
Rank: #3535.
Alvarado Elementary School
(Math: 50-54% | Reading: 65-69%)
Rank:
Rank:
9/
Top 20%10
625 Douglas St.
San Francisco, CA 94114
(415) 695-5695
San Francisco, CA 94114
(415) 695-5695
Grades: K-5
| 518 students
Show 78 more public schools in San Francisco Unified School District (out of 113 total schools)
Loading...
Frequently Asked Questions
How many schools belong to San Francisco Unified School District?
San Francisco Unified School District manages 113 public schools serving 48,670 students.
What is the rank of San Francisco Unified School District?
San Francisco Unified School District is ranked #451 out of 1,925 school districts in California (top 30%) based off of combined math and reading proficiency testing data for the 2021-2022 school year. This district ranks in the top 20% of California school districts for: Highest math proficiency (Top 20%), Most diverse schools (Top 1%) and Largest student body (number of students) (Top 1%)
What is the racial composition of students in San Francisco Unified School District?
35% of San Francisco Unified School District students are Asian, 32% of students are Hispanic, 14% of students are White, 12% of students are Two or more races, 6% of students are Black, and 1% of students are Hawaiian.
What is the student/teacher ratio of San Francisco Unified School District?
San Francisco Unified School District has a student/teacher ratio of 20:1, which is lower than the California state average of 22:1.
What is San Francisco Unified School District's spending/student ratio?
The school district's spending/student of $23,855 is higher than the state median of $18,396. The school district spending/student has grown by 6% over four school years.
Recent Articles

Year-Round Or Traditional Schedule?
Which is more appropriate for your child? A year-round attendance schedule or traditional schedule? We look at the pros and cons.

Why You Should Encourage Your Child to Join a Sports Team
Participating in team sports has a great many benefits for children, there is no doubt. In this article you will learn what those benefits are.

White Students are Now the Minority in U.S. Public Schools
Increasing birth rates among immigrant families from Asia and Central and South America, combined with lower birth rates among white families, means that for the first time in history, public school students in the United States are majority-minority. This shift in demographics poses difficulties for schools as they work to accommodate children of varying language abilities and socio-economic backgrounds.


