Top Rankings
Sanger Unified School District ranks among the top 20% of public school district in California for:
Category
Attribute
Community Size
Largest student body (number of students) (Top 1%)
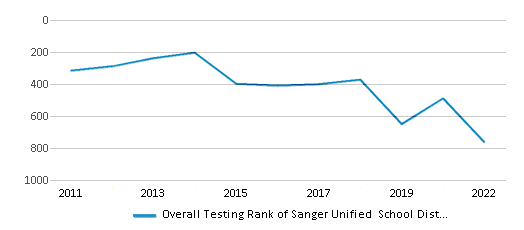
For the 2025 school year, there are 20 public schools serving 13,250 students in Sanger Unified School District. This district's average testing ranking is 7/10, which is in the top 50% of public schools in California.
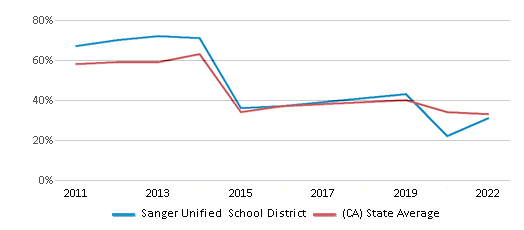
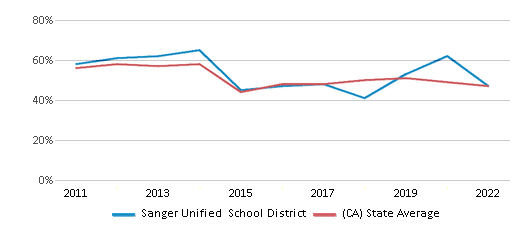
Public Schools in Sanger Unified School District have an average math proficiency score of 31% (versus the California public school average of 33%), and reading proficiency score of 47% (versus the 47% statewide average).
Minority enrollment is 90% of the student body (majority Hispanic), which is more than the California public school average of 80% (majority Hispanic).
Overview
This School District
This State (CA)
# Schools
20 Schools
10,369 Schools
# Students
13,250 Students
5,826,838 Students
# Teachers
587 Teachers
268,018 Teachers
Student : Teacher Ratio
23:1
23:1
District Rank
Sanger Unified School District, which is ranked #758 of all 1,925 school districts in California (based off of combined math and reading proficiency testing data) for the 2021-2022 school year.
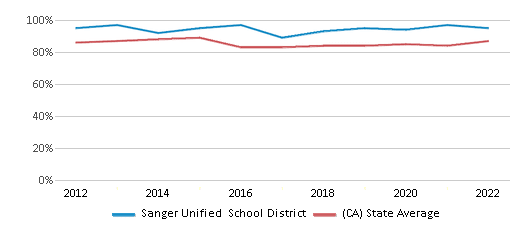
The school district's graduation rate of 95% has increased from 89% over five school years.
Overall District Rank
#763 out of 1941 school districts
(Top 50%)
(Top 50%)
Math Test Scores (% Proficient)
31%
33%
Reading/Language Arts Test Scores (% Proficient)
47%
47%
Science Test Scores (% Proficient)
23%
29%
Graduation Rate
95%
87%
Students by Ethnicity:
Diversity Score
0.49
0.63
# American Indian Students
24 Students
25,796 Students
% American Indian Students
n/a
1%
# Asian Students
1,884 Students
705,807 Students
% Asian Students
14%
12%
# Hispanic Students
9,240 Students
3,264,561 Students
% Hispanic Students
70%
56%
# Black Students
161 Students
286,112 Students
% Black Students
1%
5%
# White Students
1,380 Students
1,178,558 Students
% White Students
11%
20%
# Hawaiian Students
18 Students
23,731 Students
% Hawaiian Students
n/a
n/a
# Two or more races Students
542 Students
333,755 Students
% of Two or more races Students
4%
6%
Students by Grade:
# Students in PK Grade:
-
83
# Students in K Grade:
1,183
522,456
# Students in 1st Grade:
892
396,605
# Students in 2nd Grade:
979
414,466
# Students in 3rd Grade:
1,011
416,628
# Students in 4th Grade:
1,035
426,361
# Students in 5th Grade:
997
430,587
# Students in 6th Grade:
1,018
432,997
# Students in 7th Grade:
1,034
439,621
# Students in 8th Grade:
1,008
441,777
# Students in 9th Grade:
982
466,534
# Students in 10th Grade:
1,033
476,585
# Students in 11th Grade:
1,044
469,511
# Students in 12th Grade:
1,034
492,627
# Ungraded Students:
-
-
District Revenue and Spending
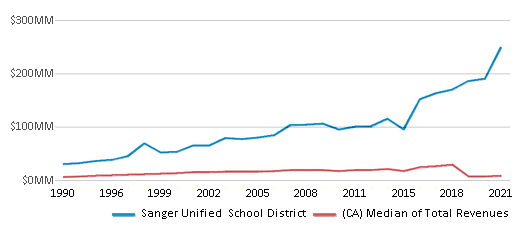
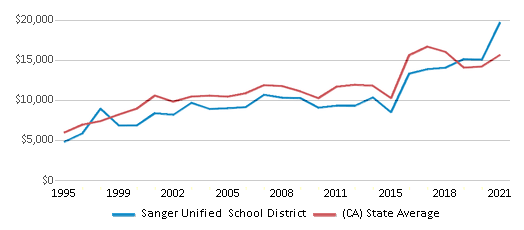
The revenue/student of $18,792 in this school district is less than the state median of $19,974. The school district revenue/student has stayed relatively flat over four school years.
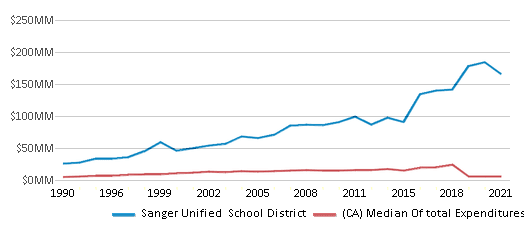
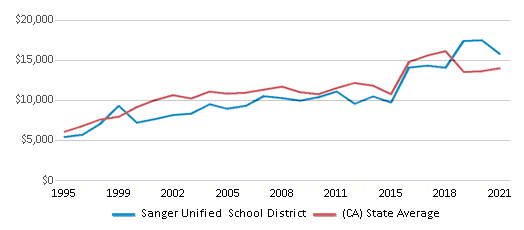
The school district's spending/student of $15,011 is less than the state median of $18,396. The school district spending/student has stayed relatively flat over four school years.
Total Revenue
$249 MM
$116,387 MM
Spending
$199 MM
$107,188 MM
Revenue / Student
$18,792
$19,974
Spending / Student
$15,011
$18,396
Best Sanger Unified School District Public Schools (2025)
School
(Math and Reading Proficiency)
(Math and Reading Proficiency)
Location
Grades
Students
Rank: #11.
Quail Lake Environmental Charter
Charter School
(Math: 68% | Reading: 75%)
Rank:
Rank:
10/
Top 10%10
4087 North Quail Lake Dr.
Clovis, CA 93611
(559) 524-6720
Clovis, CA 93611
(559) 524-6720
Grades: K-8
| 596 students
Rank: #22.
Fairmont Elementary School
(Math: 48% | Reading: 57%)
Rank:
Rank:
8/
Top 30%10
3095 North Greenwood Ave.
Sanger, CA 93657
(559) 524-6120
Sanger, CA 93657
(559) 524-6120
Grades: K-8
| 697 students
Rank: #33.
John S. Wash Elementary School
(Math: 46% | Reading: 59%)
Rank:
Rank:
8/
Top 30%10
6350 East Ln. Ave.
Fresno, CA 93727
(559) 524-6320
Fresno, CA 93727
(559) 524-6320
Grades: K-6
| 815 students
Rank: #44.
Community Day
Alternative School
(Math: <50% | Reading: <50%)
Rank:
Rank:
8/
Top 30%10
818 L St.
Sanger, CA 93657
(559) 524-6630
Sanger, CA 93657
(559) 524-6630
Grades: 7-11
| 35 students
Rank: #55.
Sanger Academy Charter
Charter School
(Math: 40% | Reading: 58%)
Rank:
Rank:
8/
Top 30%10
2207 Ninth St.
Sanger, CA 93657
(559) 524-6840
Sanger, CA 93657
(559) 524-6840
Grades: K-8
| 619 students
Rank: #66.
Sanger High School
(Math: 30% | Reading: 66%)
Rank:
Rank:
7/
Top 50%10
1045 Bethel Ave.
Sanger, CA 93657
(559) 524-7121
Sanger, CA 93657
(559) 524-7121
Grades: 9-12
| 2,443 students
Rank: #77.
Ronald W. Reagan Elementary School
(Math: 42% | Reading: 50%)
Rank:
Rank:
7/
Top 50%10
1586 South Indianola
Sanger, CA 93657
(559) 524-6780
Sanger, CA 93657
(559) 524-6780
Grades: K-6
| 491 students
Rank: #88.
Sequoia Elementary School
(Math: 37% | Reading: 50%)
Rank:
Rank:
7/
Top 50%10
1820 South Armstrong Ave.
Fresno, CA 93727
(559) 524-7500
Fresno, CA 93727
(559) 524-7500
Grades: K-6
| 692 students
Rank: #99.
Centerville Elementary School
(Math: 30-34% | Reading: 45-49%)
Rank:
Rank:
6/
Top 50%10
48 South Smith Ave.
Sanger, CA 93657
(559) 524-6000
Sanger, CA 93657
(559) 524-6000
Grades: K-8
| 419 students
Rank: #1010.
Lone Star Elementary School
(Math: 31% | Reading: 47%)
Rank:
Rank:
6/
Top 50%10
2617 South Fowler Ave.
Fresno, CA 93725
(559) 524-6430
Fresno, CA 93725
(559) 524-6430
Grades: K-6
| 641 students
Rank: #1111.
Jefferson Elementary School
(Math: 30% | Reading: 38%)
Rank:
Rank:
5/
Bottom 50%10
1110 Tucker St.
Sanger, CA 93657
(559) 524-6250
Sanger, CA 93657
(559) 524-6250
Grades: K-6
| 508 students
Rank: #1212.
Del Rey Elementary School
(Math: 25-29% | Reading: 35-39%)
Rank:
Rank:
5/
Bottom 50%10
10620 Morro St.
Del Rey, CA 93616
(559) 524-6060
Del Rey, CA 93616
(559) 524-6060
Grades: K-6
| 232 students
Rank: #1313.
Madison Elementary School
(Math: 27% | Reading: 30%)
Rank:
Rank:
4/
Bottom 50%10
2324 Cherry St.
Sanger, CA 93657
(559) 524-7430
Sanger, CA 93657
(559) 524-7430
Grades: K-6
| 431 students
Rank: #1414.
Washington Academic Middle School
(Math: 19% | Reading: 39%)
Rank:
Rank:
4/
Bottom 50%10
1705 Tenth St.
Sanger, CA 93657
(559) 524-7015
Sanger, CA 93657
(559) 524-7015
Grades: 7-8
| 1,534 students
Rank: #1515.
Lincoln Elementary School
(Math: 20% | Reading: 31%)
Rank:
Rank:
4/
Bottom 50%10
1700 14th St.
Sanger, CA 93657
(559) 524-6370
Sanger, CA 93657
(559) 524-6370
Grades: K-6
| 482 students
Rank: #1616.
Jackson Elementary School
(Math: 19% | Reading: 30%)
Rank:
Rank:
3/
Bottom 50%10
1810 Third St.
Sanger, CA 93657
(559) 524-6180
Sanger, CA 93657
(559) 524-6180
Grades: K-6
| 386 students
Rank: #1717.
Wilson Elementary School
(Math: 18% | Reading: 27%)
Rank:
Rank:
3/
Bottom 50%10
610 Faller St.
Sanger, CA 93657
(559) 524-6900
Sanger, CA 93657
(559) 524-6900
Grades: K-6
| 457 students
Rank: #1818.
Hallmark Academy
Alternative School
(Math: 11% | Reading: 32%)
Rank:
Rank:
3/
Bottom 50%10
2445 9th St.
Sanger, CA 93657
(559) 524-7190
Sanger, CA 93657
(559) 524-7190
Grades: K-12
| 313 students
Rank: #1919.
Kings River High (Continuation School)
Alternative School
(Math: ≤10% | Reading: ≤10%)
Rank:
Rank:
1/
Bottom 50%10
1801 Seventh St.
Sanger, CA 93657
(559) 524-6490
Sanger, CA 93657
(559) 524-6490
Grades: 7-12
| 73 students
Rank: n/an/a
1760 South Fowler
Fresno, CA 93727
(559) 524-3100
Fresno, CA 93727
(559) 524-3100
Grades: 9-12
| 1,386 students
Frequently Asked Questions
How many schools belong to Sanger Unified School District?
Sanger Unified School District manages 20 public schools serving 13,250 students.
What is the rank of Sanger Unified School District?
Sanger Unified School District is ranked #758 out of 1,925 school districts in California (top 50%) based off of combined math and reading proficiency testing data for the 2021-2022 school year. This district ranks in the top 20% of California school districts for: Largest student body (number of students) (Top 1%)
What is the racial composition of students in Sanger Unified School District?
70% of Sanger Unified School District students are Hispanic, 14% of students are Asian, 11% of students are White, 4% of students are Two or more races, and 1% of students are Black.
What is the student/teacher ratio of Sanger Unified School District?
Sanger Unified School District has a student/teacher ratio of 23:1, which is higher than the California state average of 22:1.
What is Sanger Unified School District's spending/student ratio?
The school district's spending/student of $15,011 is less than the state median of $18,396. The school district spending/student has stayed relatively flat over four school years.
Recent Articles

Year-Round Or Traditional Schedule?
Which is more appropriate for your child? A year-round attendance schedule or traditional schedule? We look at the pros and cons.

Why You Should Encourage Your Child to Join a Sports Team
Participating in team sports has a great many benefits for children, there is no doubt. In this article you will learn what those benefits are.

White Students are Now the Minority in U.S. Public Schools
Increasing birth rates among immigrant families from Asia and Central and South America, combined with lower birth rates among white families, means that for the first time in history, public school students in the United States are majority-minority. This shift in demographics poses difficulties for schools as they work to accommodate children of varying language abilities and socio-economic backgrounds.


