For the 2025 school year, there are 57 public elementary schools serving 26,488 students in Escambia School District. This district's average elementary testing ranking is 3/10, which is in the bottom 50% of public elementary schools in Florida.
Public Elementary Schools in Escambia School District have an average math proficiency score of 46% (versus the Florida public elementary school average of 55%), and reading proficiency score of 45% (versus the 53% statewide average).
Minority enrollment is 56% of the student body (majority Black), which is less than the Florida public elementary school average of 66% (majority Hispanic).
Overview
This School District
This State (FL)
# Schools
70 Schools
3,488 Schools
# Students
37,203 Students
2,038,029 Students
# Teachers
1,857 Teachers
118,158 Teachers
Student : Teacher Ratio
20:1
20:1
District Rank
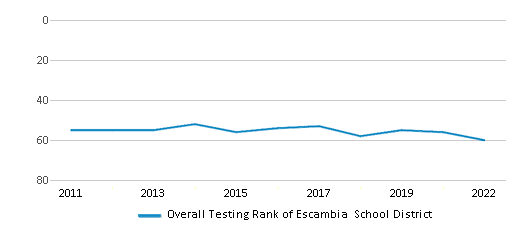
Escambia School District, which is ranked within the bottom 50% of all 73 school districts in Florida (based off of combined math and reading proficiency testing data) for the 2021-2022 school year.
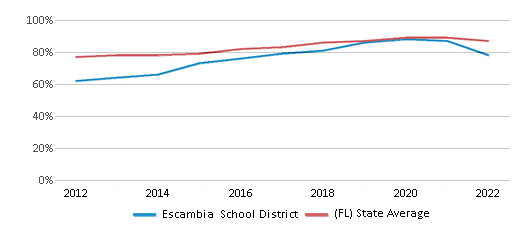
The school district's graduation rate of 78% has decreased from 79% over five school years.
Overall District Rank
#60 out of 73 school districts
(Bottom 50%)
(Bottom 50%)
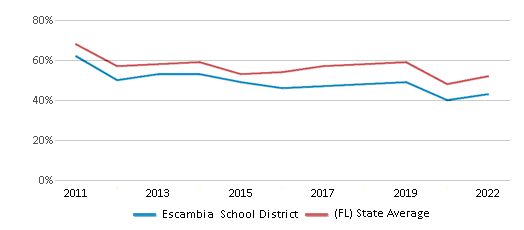
Math Test Scores (% Proficient)
43%
52%
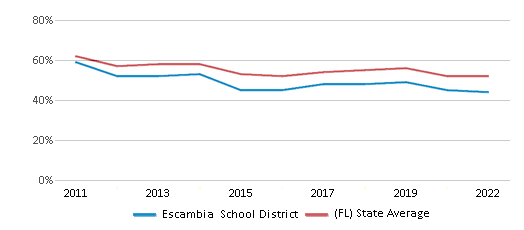
Reading/Language Arts Test Scores (% Proficient)
44%
52%
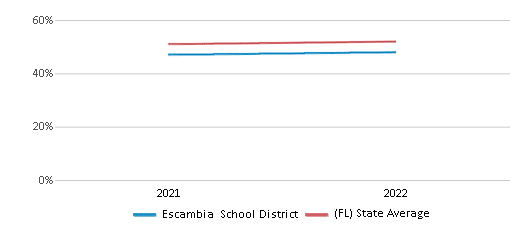
Science Test Scores (% Proficient)
48%
52%
Graduation Rate
78%
87%
Students by Ethnicity:
Diversity Score
0.67
0.71
# American Indian Students
152 Students
5,108 Students
% American Indian Students
n/a
n/a
# Asian Students
796 Students
57,983 Students
% Asian Students
2%
3%
# Hispanic Students
3,897 Students
757,879 Students
% Hispanic Students
11%
37%
# Black Students
12,713 Students
426,370 Students
% Black Students
34%
21%
# White Students
16,525 Students
697,092 Students
% White Students
45%
34%
# Hawaiian Students
138 Students
3,394 Students
% Hawaiian Students
n/a
n/a
# Two or more races Students
2,982 Students
90,203 Students
% of Two or more races Students
8%
5%
Students by Grade:
# Students in PK Grade:
865
60,744
# Students in K Grade:
2,836
195,094
# Students in 1st Grade:
3,012
204,872
# Students in 2nd Grade:
2,907
211,537
# Students in 3rd Grade:
3,020
217,908
# Students in 4th Grade:
2,771
214,300
# Students in 5th Grade:
2,540
205,644
# Students in 6th Grade:
2,656
210,929
# Students in 7th Grade:
2,603
214,610
# Students in 8th Grade:
2,773
209,847
# Students in 9th Grade:
3,166
24,319
# Students in 10th Grade:
2,906
24,087
# Students in 11th Grade:
2,806
21,774
# Students in 12th Grade:
2,342
22,364
# Ungraded Students:
-
-
District Revenue and Spending
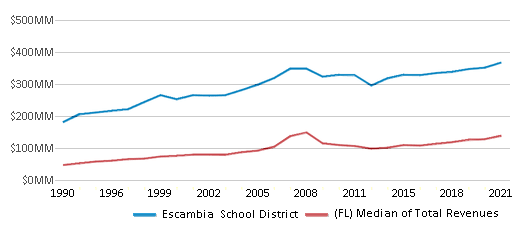
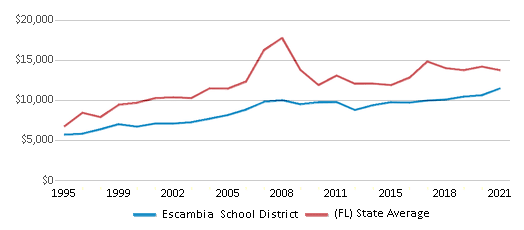
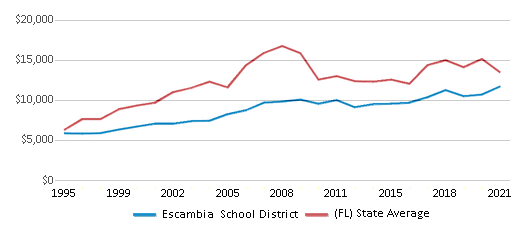
The revenue/student of $11,862 in this school district is less than the state median of $11,962. The school district revenue/student has stayed relatively flat over four school years.
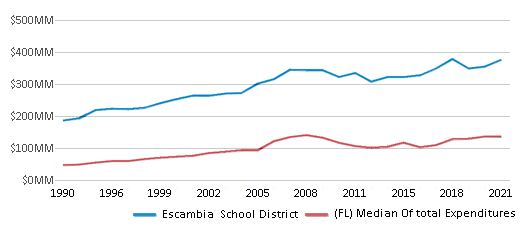
The school district's spending/student of $12,120 is higher than the state median of $11,615. The school district spending/student has stayed relatively flat over four school years.
Total Revenue
$441 MM
$34,349 MM
Spending
$451 MM
$33,354 MM
Revenue / Student
$11,862
$11,962
Spending / Student
$12,120
$11,615
Best Escambia School District Public Elementary Schools (2025)
School
(Math and Reading Proficiency)
(Math and Reading Proficiency)
Location
Grades
Students
Rank: #11.
Pensacola Beach Elementary School Inc
Charter School
(Math: 85-89% | Reading: 90-94%)
Rank:
Rank:
10/
Top 5%10
900 Via Deluna Dr
Gulf Breeze, FL 32561
(850) 934-4020
Gulf Breeze, FL 32561
(850) 934-4020
Grades: K-5
| 104 students
Rank: #22.
Brown Barge Middle School
Magnet School
(Math: 82% | Reading: 81%)
Rank:
Rank:
10/
Top 10%10
201 Hancock Ln
Pensacola, FL 32503
(850) 494-5640
Pensacola, FL 32503
(850) 494-5640
Grades: 6-8
| 549 students
Rank: #33.
N. B. Cook Elementary School
Magnet School
(Math: 84% | Reading: 76%)
Rank:
Rank:
10/
Top 10%10
1310 N 12th Ave
Pensacola, FL 32503
(850) 595-6826
Pensacola, FL 32503
(850) 595-6826
Grades: PK-5
| 532 students
Rank: #44.
Cordova Park Elementary School
(Math: 74% | Reading: 76%)
Rank:
Rank:
9/
Top 20%10
2250 Semur Rd
Pensacola, FL 32503
(850) 595-6830
Pensacola, FL 32503
(850) 595-6830
Grades: PK-5
| 598 students
Rank: #55.
A. K. Suter Elementary School
(Math: 75% | Reading: 72%)
Rank:
Rank:
9/
Top 20%10
501 Pickens Ave
Pensacola, FL 32503
(850) 595-6810
Pensacola, FL 32503
(850) 595-6810
Grades: PK-5
| 538 students
Rank: #66.
Molino Park Elementary School
(Math: 82% | Reading: 65%)
Rank:
Rank:
9/
Top 20%10
899 Highway 97
Molino, FL 32577
(850) 754-5000
Molino, FL 32577
(850) 754-5000
Grades: PK-5
| 560 students
Rank: #77.
Pleasant Grove Elementary School
(Math: 71% | Reading: 67%)
Rank:
Rank:
9/
Top 20%10
10789 Sorrento Rd
Pensacola, FL 32507
(850) 492-0233
Pensacola, FL 32507
(850) 492-0233
Grades: PK-5
| 646 students
Rank: #88.
Hellen Caro Elementary School
(Math: 69% | Reading: 66%)
Rank:
Rank:
9/
Top 20%10
12551 Meadson Rd
Pensacola, FL 32506
(850) 492-0531
Pensacola, FL 32506
(850) 492-0531
Grades: PK-5
| 529 students
Rank: #99.
Pine Meadow Elementary School
(Math: 66% | Reading: 69%)
Rank:
Rank:
9/
Top 20%10
10001 Omar Ave
Pensacola, FL 32534
(850) 494-5630
Pensacola, FL 32534
(850) 494-5630
Grades: PK-5
| 761 students
Rank: #1010.
R. C. Lipscomb Elementary School
(Math: 68% | Reading: 64%)
Rank:
Rank:
8/
Top 30%10
10200 Ashton Brosnaham Rd
Pensacola, FL 32534
(850) 494-5703
Pensacola, FL 32534
(850) 494-5703
Grades: PK-5
| 744 students
Rank: #1111.
Scenic Heights Elementary School
(Math: 65% | Reading: 60%)
Rank:
Rank:
8/
Top 30%10
3801 Cherry Laurel Dr
Pensacola, FL 32504
(850) 494-5635
Pensacola, FL 32504
(850) 494-5635
Grades: PK-5
| 804 students
Rank: #1212.
Kingsfield Elementary School
(Math: 62% | Reading: 62%)
Rank:
Rank:
8/
Top 30%10
900 W Kingsfield Rd
Cantonment, FL 32533
(850) 937-5200
Cantonment, FL 32533
(850) 937-5200
Grades: PK-5
| 931 students
Rank: #1313.
Jim Allen Elementary School
(Math: 62% | Reading: 58%)
Rank:
Rank:
8/
Top 30%10
1051 N Highway 95a
Cantonment, FL 32533
(850) 937-2260
Cantonment, FL 32533
(850) 937-2260
Grades: PK-5
| 634 students
Rank: #1414.
Blue Angels Elementary School
(Math: 55% | Reading: 66%)
Rank:
Rank:
8/
Top 30%10
1551 Dog Track Rd
Pensacola, FL 32506
(850) 457-6356
Pensacola, FL 32506
(850) 457-6356
Grades: PK-5
| 758 students
Rank: #1515.
Beulah Elementary School
(Math: 56% | Reading: 60%)
Rank:
Rank:
7/
Top 50%10
6201 Helms Rd
Pensacola, FL 32526
(850) 941-6180
Pensacola, FL 32526
(850) 941-6180
Grades: K-5
| 952 students
Rank: #1616.
Escambia Virtual Academy Franchise
(Math: 45-49% | Reading: 70-74%)
Rank:
Rank:
7/
Top 50%10
30 E Texar Dr
Pensacola, FL 32503
(850) 941-6105
Pensacola, FL 32503
(850) 941-6105
Grades: K-12
| 153 students
Rank: #1717.
Byrneville Elementary School Inc.
Charter School
(Math: 60-64% | Reading: 50-54%)
Rank:
Rank:
7/
Top 50%10
1600 Byrneville Rd
Century, FL 32535
(850) 256-6350
Century, FL 32535
(850) 256-6350
Grades: K-5
| 188 students
Rank: #18 - 1918. - 19.
Bratt Elementary School
(Math: 59% | Reading: 54%)
Rank:
Rank:
7/
Top 50%10
5721 Highway 99
Century, FL 32535
(850) 761-6200
Century, FL 32535
(850) 761-6200
Grades: PK-5
| 484 students
Rank: #18 - 1918. - 19.
Ransom Middle School
(Math: 59% | Reading: 54%)
Rank:
Rank:
7/
Top 50%10
1000 W Kingsfield Rd
Cantonment, FL 32533
(850) 937-2220
Cantonment, FL 32533
(850) 937-2220
Grades: 6-8
| 1,198 students
Rank: #2020.
Beulah Academy Of Science
Charter School
(Math: 54% | Reading: 47%)
Rank:
Rank:
6/
Top 50%10
8633 Beulah Rd
Pensacola, FL 32526
(850) 944-2822
Pensacola, FL 32526
(850) 944-2822
Grades: 6-8
| 305 students
Rank: #2121.
Escambia Sch. Dist. Jail Prog.
Alternative School
(Math: <50% | Reading: <50% )
Rank:
Rank:
5/
Bottom 50%10
30 E Texar Dr
Pensacola, FL 32503
(850) 436-9713
Pensacola, FL 32503
(850) 436-9713
Grades: 6-12
| 9 students
Rank: #2222.
Escambia Boys' Base
Alternative School
(Math: <50% | Reading: <50% )
Rank:
Rank:
5/
Bottom 50%10
640 Roberts Ave
Pensacola, FL 32511
(850) 453-7521
Pensacola, FL 32511
(850) 453-7521
Grades: 6-12
| 27 students
Rank: #2323.
L. D. Mcarthur Elementary School
(Math: 48% | Reading: 49%)
Rank:
Rank:
5/
Bottom 50%10
330 E Ten Mile Rd
Pensacola, FL 32534
(850) 494-5625
Pensacola, FL 32534
(850) 494-5625
Grades: PK-5
| 549 students
Rank: #2424.
Ernest Ward Middle School
(Math: 44% | Reading: 50%)
Rank:
Rank:
5/
Bottom 50%10
7650 Highway 97
Mc David, FL 32568
(850) 761-6301
Mc David, FL 32568
(850) 761-6301
Grades: 6-8
| 490 students
Rank: #2525.
Hospital & Homebound
Special Education School
(Math: <50% | Reading: <50% )
Rank:
Rank:
5/
Bottom 50%10
40 E Texar Dr
Pensacola, FL 32503
(850) 429-2977
Pensacola, FL 32503
(850) 429-2977
Grades: PK-12
| 25 students
Rank: #2626.
Escambia Virtual Instructional Program (District Provided)
(Math: <50% | Reading: ≥50% )
Rank:
Rank:
4/
Bottom 50%10
30 E Texar Dr
Pensacola, FL 32503
(850) 469-5457
Pensacola, FL 32503
(850) 469-5457
Grades: K-12
| n/a students
Rank: #2727.
Longleaf Elementary School
(Math: 43% | Reading: 46%)
Rank:
Rank:
4/
Bottom 50%10
2600 Longleaf Dr
Pensacola, FL 32526
(850) 941-6110
Pensacola, FL 32526
(850) 941-6110
Grades: PK-5
| 509 students
Rank: #2828.
Ferry Pass Elementary School
(Math: 47% | Reading: 41%)
Rank:
Rank:
4/
Bottom 50%10
8310 N Davis Hwy
Pensacola, FL 32514
(850) 494-5605
Pensacola, FL 32514
(850) 494-5605
Grades: PK-5
| 578 students
Rank: #2929.
Escambia Virtual Instruction Program
(Math: 20-29% | Reading: 50-59%)
Rank:
Rank:
4/
Bottom 50%10
30 E Texar Dr
Pensacola, FL 32503
(850) 469-5457
Pensacola, FL 32503
(850) 469-5457
Grades: K-12
| 35 students
Rank: #3030.
Hope Horizon At Judy Andrews Center
Special Education School
(Math: 21-39% | Reading: <50%)
Rank:
Rank:
4/
Bottom 50%10
129 N Merritt St
Pensacola, FL 32507
(850) 453-7456
Pensacola, FL 32507
(850) 453-7456
Grades: K-12
| 34 students
Rank: #3131.
Beulah Middle School
(Math: 41% | Reading: 40%)
Rank:
Rank:
4/
Bottom 50%10
6001 W Nine Mile Rd
Pensacola, FL 32526
(850) 316-3800
Pensacola, FL 32526
(850) 316-3800
Grades: 6-8
| 1,004 students
Rank: #32 - 3432. - 34.
Brentwood Elementary School
(Math: 35-39% | Reading: 40-44%)
Rank:
Rank:
3/
Bottom 50%10
4820 N Palafox St
Pensacola, FL 32505
(850) 595-6800
Pensacola, FL 32505
(850) 595-6800
Grades: PK-5
| 402 students
Rank: #32 - 3432. - 34.
Lincoln Park Elementary School
(Math: 35-39% | Reading: 40-44%)
Rank:
Rank:
3/
Bottom 50%10
7600 Kershaw St
Pensacola, FL 32534
(850) 494-5620
Pensacola, FL 32534
(850) 494-5620
Grades: PK-5
| 218 students
Rank: #32 - 3432. - 34.
Navy Point Elementary School
(Math: 35-39% | Reading: 40-44%)
Rank:
Rank:
3/
Bottom 50%10
1321 Patton Dr
Pensacola, FL 32507
(850) 453-7415
Pensacola, FL 32507
(850) 453-7415
Grades: PK-5
| 428 students
Rank: #3535.
Jim C. Bailey Middle School
(Math: 38% | Reading: 41%)
Rank:
Rank:
3/
Bottom 50%10
4110 Bauer Rd
Pensacola, FL 32506
(850) 492-6136
Pensacola, FL 32506
(850) 492-6136
Grades: 6-8
| 1,097 students
Show 22 more public schools in Escambia School District (out of 57 total schools)
Loading...
Recent Articles

Sexual Harassment at Age 6: The Tale of a First Grade Suspension
A six-year old in Aurora, Colorado, was suspended after singing an LMFAO song to a little girl in his class and reportedly “shaking his booty.” We look at the case and the sexual harassment problem in public schools today.

How Scaffolding Could Change the Way Your Child Learns
This article explores the concept of instructional scaffolding, a teaching method that enhances learning by breaking down complex tasks into manageable parts. It highlights how scaffolding supports students in developing critical thinking skills and becoming more independent learners. The article discusses the benefits of scaffolding, including improved engagement and reduced anxiety, and provides strategies for its implementation across various educational levels.

February 05, 2025
Understanding the U.S. Department of Education: Structure, Impact, and EvolutionWe explore how the Department of Education shapes American education, from its cabinet-level leadership to its impact on millions of students, written for general audiences seeking clarity on this vital institution.


