Top Rankings
St. Lucie School District ranks among the top 20% of public school district in Florida for:
Category
Attribute
Diversity
Most diverse schools (Top 1%)
For the 2025 school year, there are 20 public high schools serving 18,399 students in St. Lucie School District. This district's average high testing ranking is 5/10, which is in the bottom 50% of public high schools in Florida.
Public High Schools in St. Lucie School District have an average math proficiency score of 37% (versus the Florida public high school average of 42%), and reading proficiency score of 51% (versus the 51% statewide average).
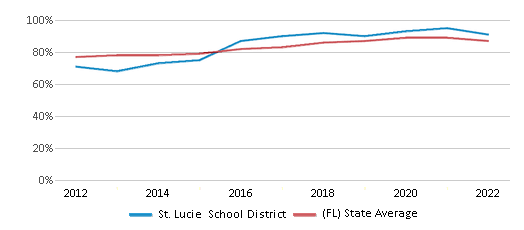
Public High School in St. Lucie School District have a Graduation Rate of 91%, which is more than the Florida average of 87%.
The school with highest graduation rate is Treasure Coast High School, with 97% graduation rate. Read more about public school graduation rate statistics in Florida or national school graduation rate statistics.
Minority enrollment is 73% of the student body (majority Hispanic and Black), which is more than the Florida public high school average of 65% (majority Hispanic).
Overview
This School District
This State (FL)
# Schools
55 Schools
1,351 Schools
# Students
46,987 Students
1,018,327 Students
# Teachers
2,353 Teachers
47,312 Teachers
Student : Teacher Ratio
20:1
20:1
District Rank
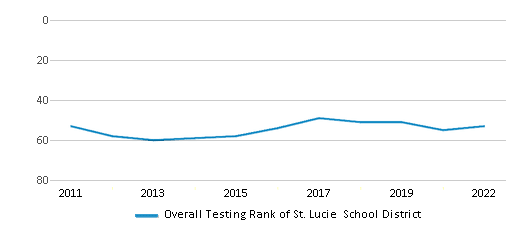
St. Lucie School District, which is ranked within the bottom 50% of all 73 school districts in Florida (based off of combined math and reading proficiency testing data) for the 2021-2022 school year.
The school district's graduation rate of 91% has increased from 90% over five school years.
Overall District Rank
#53 out of 73 school districts
(Bottom 50%)
(Bottom 50%)
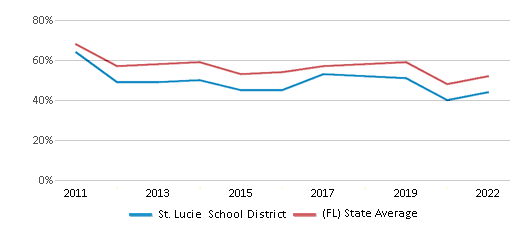
Math Test Scores (% Proficient)
44%
52%
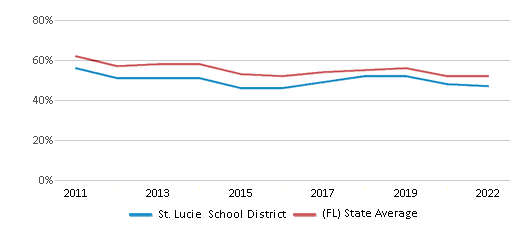
Reading/Language Arts Test Scores (% Proficient)
47%
52%
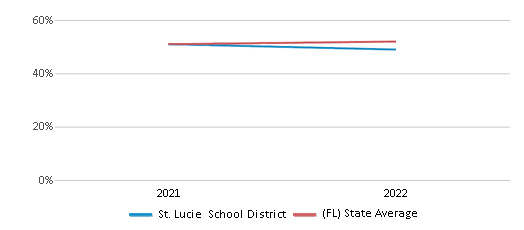
Science Test Scores (% Proficient)
49%
52%
Graduation Rate
91%
87%
Students by Ethnicity:
Diversity Score
0.71
0.70
# American Indian Students
71 Students
2,850 Students
% American Indian Students
n/a
n/a
# Asian Students
681 Students
29,850 Students
% Asian Students
2%
3%
# Hispanic Students
16,325 Students
371,091 Students
% Hispanic Students
35%
37%
# Black Students
15,696 Students
215,821 Students
% Black Students
33%
21%
# White Students
11,871 Students
358,997 Students
% White Students
25%
35%
# Hawaiian Students
66 Students
1,845 Students
% Hawaiian Students
n/a
n/a
# Two or more races Students
2,277 Students
37,873 Students
% of Two or more races Students
5%
4%
Students by Grade:
# Students in PK Grade:
636
2,742
# Students in K Grade:
3,152
6,456
# Students in 1st Grade:
3,180
6,640
# Students in 2nd Grade:
3,292
6,803
# Students in 3rd Grade:
3,383
7,448
# Students in 4th Grade:
3,307
7,271
# Students in 5th Grade:
3,160
6,880
# Students in 6th Grade:
3,463
19,490
# Students in 7th Grade:
3,822
24,772
# Students in 8th Grade:
3,576
26,189
# Students in 9th Grade:
3,911
233,011
# Students in 10th Grade:
4,126
236,046
# Students in 11th Grade:
3,967
221,011
# Students in 12th Grade:
4,012
213,568
# Ungraded Students:
-
-
District Revenue and Spending
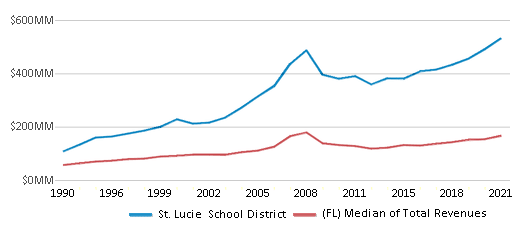
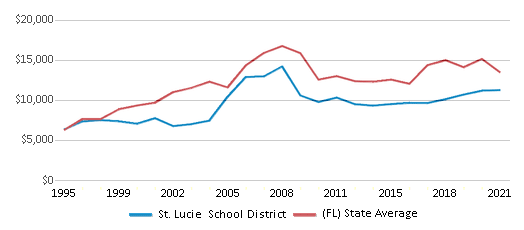
The revenue/student of $11,330 in this school district is less than the state median of $11,962. The school district revenue/student has declined by 11% over four school years.
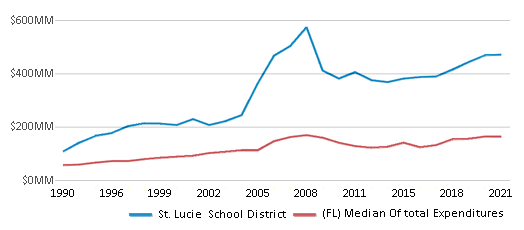
The school district's spending/student of $10,025 is less than the state median of $11,615. The school district spending/student has declined by 11% over four school years.
Total Revenue
$532 MM
$34,349 MM
Spending
$471 MM
$33,354 MM
Revenue / Student
$11,330
$11,962
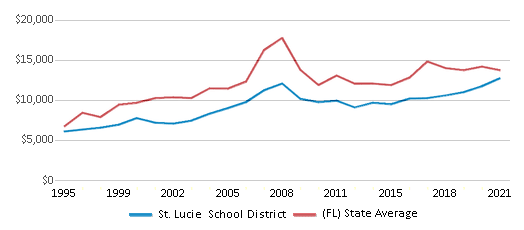
Spending / Student
$10,025
$11,615
Best St. Lucie School District Public High Schools (2025)
School
(Math and Reading Proficiency)
(Math and Reading Proficiency)
Location
Grades
Students
Rank: #11.
Mosaic Digital Academy (St. Lucie Virtual Franchise) Pt
(Math: 63% | Reading: 75%)
Rank:
Rank:
9/
Top 20%10
12051 Nw Copper Creek Dr
Port Saint Lucie, FL 34987
(772) 429-5504
Port Saint Lucie, FL 34987
(772) 429-5504
Grades: 6-12
| n/a students
Rank: #22.
Somerset College Preparatory Academy
Charter School
(Math: 61% | Reading: 63%)
Rank:
Rank:
8/
Top 30%10
725 Nw California Blvd
Port Saint Lucie, FL 34986
(772) 343-7028
Port Saint Lucie, FL 34986
(772) 343-7028
Grades: 6-12
| 1,387 students
Rank: #33.
Lincoln Park Academy
Magnet School
(Math: 55% | Reading: 67%)
Rank:
Rank:
8/
Top 30%10
1806 Avenue I
Fort Pierce, FL 34950
(772) 468-5474
Fort Pierce, FL 34950
(772) 468-5474
Grades: 6-12
| 1,680 students
Rank: #44.
St. Lucie Detention Center
Alternative School
(Math: <50% | Reading: <50% )
Rank:
Rank:
5/
Bottom 50%10
1301 Bell Ave
Fort Pierce, FL 34982
(772) 468-5194
Fort Pierce, FL 34982
(772) 468-5194
Grades: K-12
| 65 students
Rank: #55.
Treasure Coast High School
(Math: 40% | Reading: 52%)
Rank:
Rank:
5/
Bottom 50%10
1000 Sw Darwin Blvd
Port Saint Lucie, FL 34953
(772) 807-4300
Port Saint Lucie, FL 34953
(772) 807-4300
Grades: 9-12
| 3,114 students
Rank: #66.
St. Lucie Virtual Instruction Program
(Math: ≤20% | Reading: 60-69%)
Rank:
Rank:
5/
Bottom 50%10
12051 Nw Copper Creek Dr
Port Saint Lucie, FL 34987
(772) 429-3913
Port Saint Lucie, FL 34987
(772) 429-3913
Grades: K-12
| 13 students
Rank: #77.
Mosaic Digital Academy K-12
(Math: ≥50% | Reading: ≥50% )
Rank:
Rank:
5/
Bottom 50%10
9461 Brandywine Ln
Port Saint Lucie, FL 34986
(772) 429-5504
Port Saint Lucie, FL 34986
(772) 429-5504
Grades: K-12
| 255 students
Rank: #88.
St. Lucie County Jail - Rock Road Academy
Alternative School
(Math: <50% | Reading: <50% )
Rank:
Rank:
4/
Bottom 50%10
9461 Brandywine Ln
Port Saint Lucie, FL 34986
(772) 462-3450
Port Saint Lucie, FL 34986
(772) 462-3450
Grades: 6-12
| 24 students
Rank: #99.
Tradition Preparatory High School
Charter School
(Math: 36% | Reading: 50%)
Rank:
Rank:
4/
Bottom 50%10
800 Corporate Drive, Suite 700
Fort Lauderdale, FL 33334
(772) 236-7034
Fort Lauderdale, FL 33334
(772) 236-7034
Grades: 9-12
| 965 students
Rank: #1010.
St. Lucie West Centennial High School
(Math: 28% | Reading: 47%)
Rank:
Rank:
3/
Bottom 50%10
1485 Sw Cashmere Blvd
Port Saint Lucie, FL 34986
(772) 344-4400
Port Saint Lucie, FL 34986
(772) 344-4400
Grades: 9-12
| 2,702 students
Rank: #1111.
Independence Classical Academy
Charter School
(Math: 25-29% | Reading: 45-49%)
Rank:
Rank:
3/
Bottom 50%10
2902 S. Jenkins Road
Fort Pierce, FL 34981
(772) 837-9300
Fort Pierce, FL 34981
(772) 837-9300
Grades: K-12
| 472 students
Rank: #1212.
Fort Pierce Central High School
(Math: 24% | Reading: 48%)
Rank:
Rank:
3/
Bottom 50%10
4101 S 25th St
Fort Pierce, FL 34981
(772) 468-5888
Fort Pierce, FL 34981
(772) 468-5888
Grades: 9-12
| 3,187 students
Rank: #1313.
Port St. Lucie High School
Magnet School
(Math: 25% | Reading: 40%)
Rank:
Rank:
2/
Bottom 50%10
1201 Se Jaguar Ln
Port Saint Lucie, FL 34952
(772) 337-6770
Port Saint Lucie, FL 34952
(772) 337-6770
Grades: 9-12
| 1,811 students
Rank: #1414.
Fort Pierce Westwood Academy The W.e.s.t. Prep Magnet
Magnet School
(Math: 21% | Reading: 31%)
Rank:
Rank:
1/
Bottom 50%10
1801 Panther Ln
Fort Pierce, FL 34947
(772) 468-5400
Fort Pierce, FL 34947
(772) 468-5400
Grades: 9-12
| 1,956 students
Rank: #1515.
Pace Center For Girls Treasure Coast
Alternative School
(Math: ≤20% | Reading: 21-39%)
Rank:
Rank:
1/
Bottom 50%10
3651 Virginia Ave
Fort Pierce, FL 34981
(772) 595-8880
Fort Pierce, FL 34981
(772) 595-8880
Grades: 6-12
| 37 students
Rank: #1616.
Dale Cassens Education Complex
Alternative School
(Math: ≤20% | Reading: 21-39% )
Rank:
Rank:
1/
Bottom 50%10
1905 S 11th St
Fort Pierce, FL 34950
(772) 468-5190
Fort Pierce, FL 34950
(772) 468-5190
Grades: PK-12
| 212 students
Rank: #1717.
Performance Based Preparatory Academy
Alternative School
(Math: ≤20% | Reading: ≤20% )
Rank:
Rank:
1/
Bottom 50%10
2909 Delaware Ave
Fort Pierce, FL 34947
(772) 468-5194
Fort Pierce, FL 34947
(772) 468-5194
Grades: 9-12
| 141 students
Rank: n/an/a
Acceleration Academy
Alternative School
329 Se Port St Lucie Blvd
Port Saint Lucie, FL 34984
(772) 618-1777
Port Saint Lucie, FL 34984
(772) 618-1777
Grades: 8-12
| 364 students
Rank: n/an/a
Data House
Alternative School
4590 Selvitz Rd
Fort Pierce, FL 34981
(772) 467-4020
Fort Pierce, FL 34981
(772) 467-4020
Grades: 6-12
| 14 students
Rank: n/an/a
Homebound Program
Special Education School
9461 Brandywine Ln
Port Saint Lucie, FL 34986
(772) 429-4570
Port Saint Lucie, FL 34986
(772) 429-4570
Grades: K-12
| n/a students
Recent Articles

The Pros and Cons of Mandatory Gym Class in Public Schools
Leaders debate the pros and cons of mandatory gym classes in public schools. Learn more about the controversy and whether gym class should be a phenomenon of the past.

Year-Round Or Traditional Schedule?
Which is more appropriate for your child? A year-round attendance schedule or traditional schedule? We look at the pros and cons.

The Evolving Role of Interim Assessments
Explore the often-overlooked tool in K-12 education - interim assessments. Understand what they are, their importance, and how they can enhance your child's learning experience. Dive into real-world case studies and find out how technology is changing the game. This informative, parent-friendly article aims to shed light on the value of these assessments in today's educational landscape.


