Top Rankings
St. Lucie School District ranks among the top 20% of public school district in Florida for:
Category
Attribute
Diversity
Most diverse schools (Top 1%)
For the 2025 school year, there are 23 public preschools serving 18,882 students in St. Lucie School District. This district's average pre testing ranking is 3/10, which is in the bottom 50% of public pre schools in Florida.
Public Preschools in St. Lucie School District have an average math proficiency score of 48% (versus the Florida public pre school average of 57%), and reading proficiency score of 46% (versus the 54% statewide average).
Minority enrollment is 77% of the student body (majority Hispanic), which is more than the Florida public preschool average of 65% (majority Hispanic).
Overview
This School District
This State (FL)
# Schools
55 Schools
1,902 Schools
# Students
46,987 Students
1,124,074 Students
# Teachers
2,353 Teachers
71,061 Teachers
Student : Teacher Ratio
20:1
20:1
District Rank
St. Lucie School District, which is ranked within the bottom 50% of all 73 school districts in Florida (based off of combined math and reading proficiency testing data) for the 2021-2022 school year.
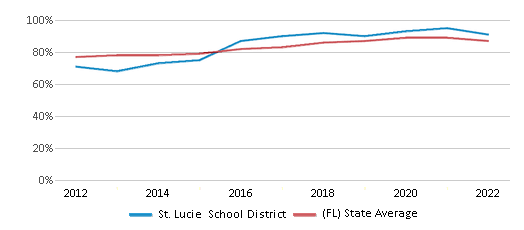
The school district's graduation rate of 91% has increased from 90% over five school years.
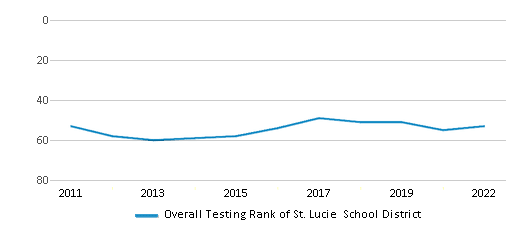
Overall District Rank
#53 out of 73 school districts
(Bottom 50%)
(Bottom 50%)
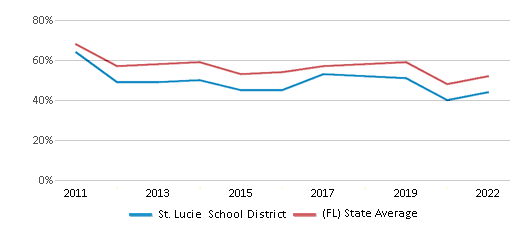
Math Test Scores (% Proficient)
44%
52%
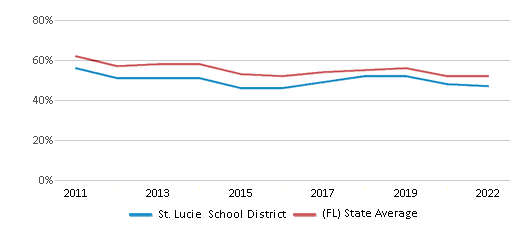
Reading/Language Arts Test Scores (% Proficient)
47%
52%
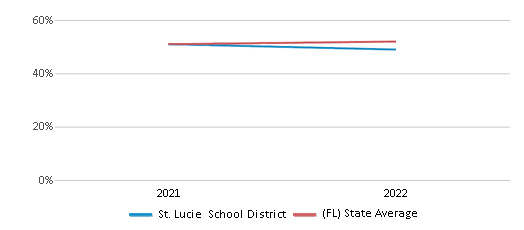
Science Test Scores (% Proficient)
49%
52%
Graduation Rate
91%
87%
Students by Ethnicity:
Diversity Score
0.71
0.71
# American Indian Students
71 Students
2,515 Students
% American Indian Students
n/a
n/a
# Asian Students
681 Students
28,808 Students
% Asian Students
2%
3%
# Hispanic Students
16,325 Students
409,820 Students
% Hispanic Students
35%
36%
# Black Students
15,696 Students
236,066 Students
% Black Students
33%
21%
# White Students
11,871 Students
392,557 Students
% White Students
25%
35%
# Hawaiian Students
66 Students
1,696 Students
% Hawaiian Students
n/a
n/a
# Two or more races Students
2,277 Students
52,612 Students
% of Two or more races Students
5%
5%
Students by Grade:
# Students in PK Grade:
636
64,349
# Students in K Grade:
3,152
154,392
# Students in 1st Grade:
3,180
161,963
# Students in 2nd Grade:
3,292
167,396
# Students in 3rd Grade:
3,383
171,016
# Students in 4th Grade:
3,307
167,752
# Students in 5th Grade:
3,160
159,415
# Students in 6th Grade:
3,463
27,337
# Students in 7th Grade:
3,822
19,963
# Students in 8th Grade:
3,576
19,106
# Students in 9th Grade:
3,911
2,380
# Students in 10th Grade:
4,126
2,273
# Students in 11th Grade:
3,967
2,437
# Students in 12th Grade:
4,012
4,295
# Ungraded Students:
-
-
District Revenue and Spending
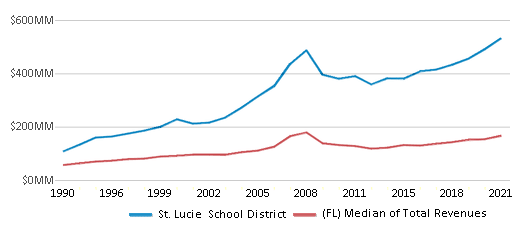
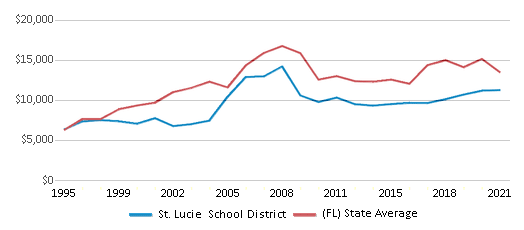
The revenue/student of $11,330 in this school district is less than the state median of $11,962. The school district revenue/student has declined by 11% over four school years.
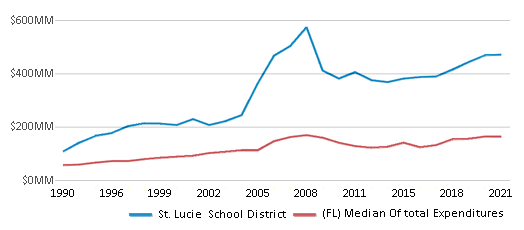
The school district's spending/student of $10,025 is less than the state median of $11,615. The school district spending/student has declined by 11% over four school years.
Total Revenue
$532 MM
$34,349 MM
Spending
$471 MM
$33,354 MM
Revenue / Student
$11,330
$11,962
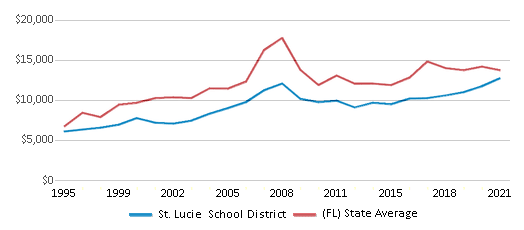
Spending / Student
$10,025
$11,615
Best St. Lucie School District Public Preschools (2025)
School
(Math and Reading Proficiency)
(Math and Reading Proficiency)
Location
Grades
Students
Rank: #11.
Fairlawn Elementary School
Magnet School
(Math: 80% | Reading: 74%)
Rank:
Rank:
10/
Top 10%10
3203 Rhode Island Ave
Fort Pierce, FL 34947
(772) 468-5345
Fort Pierce, FL 34947
(772) 468-5345
Grades: PK-5
| 646 students
Rank: #22.
Morningside Elementary School
(Math: 78% | Reading: 74%)
Rank:
Rank:
9/
Top 20%10
2300 Se Gowin Dr
Port Saint Lucie, FL 34952
(772) 337-6730
Port Saint Lucie, FL 34952
(772) 337-6730
Grades: PK-5
| 667 students
Rank: #33.
Mariposa Elementary School
(Math: 63% | Reading: 54%)
Rank:
Rank:
7/
Top 50%10
2620 Se Mariposa Ave
Port Saint Lucie, FL 34952
(772) 337-5960
Port Saint Lucie, FL 34952
(772) 337-5960
Grades: PK-5
| 756 students
Rank: #44.
West Gate K-8 School
(Math: 55% | Reading: 56%)
Rank:
Rank:
7/
Top 50%10
1050 Nw Cashmere Blvd
Port Saint Lucie, FL 34986
(772) 807-7600
Port Saint Lucie, FL 34986
(772) 807-7600
Grades: PK-8
| 1,582 students
Rank: #55.
Rivers Edge Elementary School
(Math: 55% | Reading: 52%)
Rank:
Rank:
6/
Top 50%10
5600 Ne Saint James Dr
Port Saint Lucie, FL 34983
(772) 785-5600
Port Saint Lucie, FL 34983
(772) 785-5600
Grades: PK-5
| 747 students
Rank: #66.
Windmill Point Elementary School
(Math: 52% | Reading: 51%)
Rank:
Rank:
6/
Top 50%10
700 Sw Darwin Blvd
Port Saint Lucie, FL 34953
(772) 336-6950
Port Saint Lucie, FL 34953
(772) 336-6950
Grades: PK-5
| 1,058 students
Rank: #77.
Renaissance Charter School Of St. Lucie
Charter School
(Math: 50% | Reading: 51%)
Rank:
Rank:
6/
Top 50%10
300 Nw Cashmere Blvd
Port Saint Lucie, FL 34986
(772) 344-5982
Port Saint Lucie, FL 34986
(772) 344-5982
Grades: PK-8
| 1,415 students
Rank: #8 - 98. - 9.
Floresta Elementary School
(Math: 53% | Reading: 48%)
Rank:
Rank:
6/
Top 50%10
1501 Se Floresta Dr
Port Saint Lucie, FL 34983
(772) 340-4755
Port Saint Lucie, FL 34983
(772) 340-4755
Grades: PK-5
| 651 students
Rank: #8 - 98. - 9.
Samuel S. Gaines Academy Of Emerging Technologies
Magnet School
(Math: 53% | Reading: 48%)
Rank:
Rank:
6/
Top 50%10
2250 S Jenkins Rd
Fort Pierce, FL 34947
(772) 462-8888
Fort Pierce, FL 34947
(772) 462-8888
Grades: PK-8
| 702 students
Rank: #1010.
Bayshore Elementary School
(Math: 54% | Reading: 47%)
Rank:
Rank:
6/
Top 50%10
1661 Sw Bayshore Blvd
Port Saint Lucie, FL 34984
(772) 340-4720
Port Saint Lucie, FL 34984
(772) 340-4720
Grades: PK-5
| 871 students
Rank: #1111.
Allapattah Flats K-8
(Math: 50% | Reading: 47%)
Rank:
Rank:
5/
Bottom 50%10
12051 Nw Copper Creek Dr
Port Saint Lucie, FL 34987
(772) 468-5050
Port Saint Lucie, FL 34987
(772) 468-5050
Grades: PK-8
| 1,312 students
Rank: #1212.
Village Green Environmental Studies School
Magnet School
(Math: 41% | Reading: 48%)
Rank:
Rank:
4/
Bottom 50%10
1700 Se Lennard Rd
Port Saint Lucie, FL 34952
(772) 337-6750
Port Saint Lucie, FL 34952
(772) 337-6750
Grades: PK-5
| 597 students
Rank: #1313.
Frances K. Sweet Elementary School
Magnet School
(Math: 47% | Reading: 42%)
Rank:
Rank:
4/
Bottom 50%10
1400 Avenue Q
Fort Pierce, FL 34950
(772) 468-5330
Fort Pierce, FL 34950
(772) 468-5330
Grades: PK-5
| 364 students
Rank: #1414.
Northport K-8 School
(Math: 42% | Reading: 42%)
Rank:
Rank:
4/
Bottom 50%10
250 Nw Floresta Dr
Port Saint Lucie, FL 34983
(772) 340-4700
Port Saint Lucie, FL 34983
(772) 340-4700
Grades: PK-8
| 1,265 students
Rank: #1515.
Oak Hammock K-8 School
(Math: 39% | Reading: 41%)
Rank:
Rank:
3/
Bottom 50%10
1251 Sw California Blvd
Port Saint Lucie, FL 34953
(772) 344-4490
Port Saint Lucie, FL 34953
(772) 344-4490
Grades: PK-8
| 1,704 students
Rank: #1616.
Lawnwood Elementary School
(Math: 45% | Reading: 33%)
Rank:
Rank:
3/
Bottom 50%10
1900 S 23rd St
Fort Pierce, FL 34950
(772) 468-5740
Fort Pierce, FL 34950
(772) 468-5740
Grades: PK-5
| 783 students
Rank: #1717.
White City Elementary School
(Math: 41% | Reading: 32%)
Rank:
Rank:
3/
Bottom 50%10
905 W 2nd St
Fort Pierce, FL 34982
(772) 468-5840
Fort Pierce, FL 34982
(772) 468-5840
Grades: PK-5
| 504 students
Rank: #1818.
Weatherbee Elementary School
(Math: 34% | Reading: 38%)
Rank:
Rank:
3/
Bottom 50%10
800 E Weatherbee Rd
Fort Pierce, FL 34982
(772) 468-5300
Fort Pierce, FL 34982
(772) 468-5300
Grades: PK-5
| 728 students
Rank: #1919.
Parkway Elementary School
(Math: 39% | Reading: 32%)
Rank:
Rank:
3/
Bottom 50%10
7000 Nw Selvitz Rd
Port Saint Lucie, FL 34983
(772) 340-4800
Port Saint Lucie, FL 34983
(772) 340-4800
Grades: PK-5
| 545 students
Rank: #2020.
Savanna Ridge Elementary School
(Math: 36% | Reading: 36%)
Rank:
Rank:
3/
Bottom 50%10
6801 Se Lennard Rd
Port Saint Lucie, FL 34952
(772) 460-3050
Port Saint Lucie, FL 34952
(772) 460-3050
Grades: PK-5
| 471 students
Rank: #2121.
Lakewood Park Elementary School
(Math: 33% | Reading: 35%)
Rank:
Rank:
2/
Bottom 50%10
7800 Indrio Rd
Fort Pierce, FL 34951
(772) 468-5830
Fort Pierce, FL 34951
(772) 468-5830
Grades: PK-5
| 640 students
Rank: #2222.
Dale Cassens Education Complex
Alternative School
(Math: ≤20% | Reading: 21-39% )
Rank:
Rank:
1/
Bottom 50%10
1905 S 11th St
Fort Pierce, FL 34950
(772) 468-5190
Fort Pierce, FL 34950
(772) 468-5190
Grades: PK-12
| 212 students
Rank: #2323.
St. Lucie Elementary School
(Math: 25% | Reading: 22%)
Rank:
Rank:
1/
Bottom 50%10
2020 S 13th St
Fort Pierce, FL 34950
(772) 468-5213
Fort Pierce, FL 34950
(772) 468-5213
Grades: PK-5
| 662 students
Recent Articles

The Pros and Cons of Mandatory Gym Class in Public Schools
Leaders debate the pros and cons of mandatory gym classes in public schools. Learn more about the controversy and whether gym class should be a phenomenon of the past.

Year-Round Or Traditional Schedule?
Which is more appropriate for your child? A year-round attendance schedule or traditional schedule? We look at the pros and cons.

The Evolving Role of Interim Assessments
Explore the often-overlooked tool in K-12 education - interim assessments. Understand what they are, their importance, and how they can enhance your child's learning experience. Dive into real-world case studies and find out how technology is changing the game. This informative, parent-friendly article aims to shed light on the value of these assessments in today's educational landscape.


