Top Rankings
Waukegan CUSD 60 School District ranks among the top 20% of public school district in Illinois for:
Category
Attribute
Community Size
Largest student body (number of students) (Top 1%)
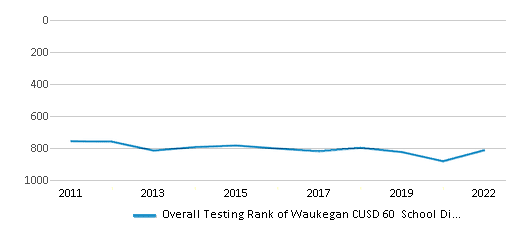
For the 2025 school year, there are 22 public schools serving 13,666 students in Waukegan CUSD 60 School District. This district's average testing ranking is 1/10, which is in the bottom 50% of public schools in Illinois.
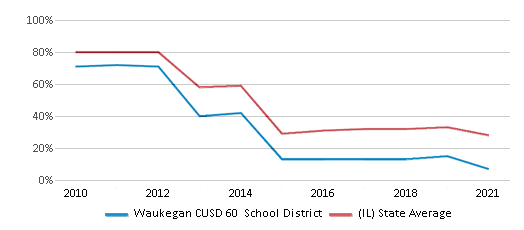
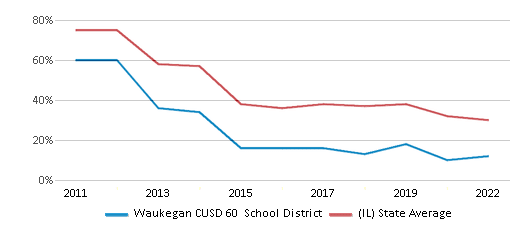
Public Schools in Waukegan CUSD 60 School District have an average math proficiency score of 8% (versus the Illinois public school average of 26%), and reading proficiency score of 11% (versus the 30% statewide average).
Minority enrollment is 97% of the student body (majority Hispanic), which is more than the Illinois public school average of 56% (majority Hispanic).
Overview
This School District
This State (IL)
# Schools
22 Schools
4,399 Schools
# Students
13,666 Students
1,881,773 Students
# Teachers
909 Teachers
136,664 Teachers
Student : Teacher Ratio
15:1
15:1
District Rank
Waukegan CUSD 60 School District, which is ranked within the bottom 50% of all 844 school districts in Illinois (based off of combined math and reading proficiency testing data) for the 2020-2021 school year.
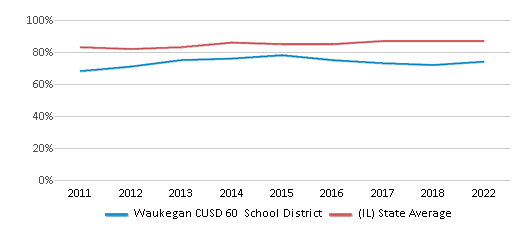
The school district's graduation rate of 74% has decreased from 76% over five school years.
Overall District Rank
#813 out of 852 school districts
(Bottom 50%)
(Bottom 50%)
Math Test Scores (% Proficient)
(20-21)7%
28%
Reading/Language Arts Test Scores (% Proficient)
12%
30%
Science Test Scores (% Proficient)
30%
50%
Graduation Rate
74%
87%
Students by Ethnicity:
Diversity Score
0.33
0.70
# American Indian Students
97 Students
4,556 Students
% American Indian Students
1%
1%
# Asian Students
214 Students
103,630 Students
% Asian Students
1%
6%
# Hispanic Students
11,048 Students
517,685 Students
% Hispanic Students
81%
28%
# Black Students
1,670 Students
303,129 Students
% Black Students
12%
16%
# White Students
378 Students
837,178 Students
% White Students
3%
45%
# Hawaiian Students
16 Students
1,684 Students
% Hawaiian Students
n/a
n/a
# Two or more races Students
243 Students
78,057 Students
% of Two or more races Students
2%
4%
Students by Grade:
# Students in PK Grade:
563
79,660
# Students in K Grade:
856
120,716
# Students in 1st Grade:
960
126,380
# Students in 2nd Grade:
1,003
167,371
# Students in 3rd Grade:
1,050
130,316
# Students in 4th Grade:
944
130,337
# Students in 5th Grade:
961
129,914
# Students in 6th Grade:
971
132,189
# Students in 7th Grade:
996
135,696
# Students in 8th Grade:
1,038
137,626
# Students in 9th Grade:
1,106
149,483
# Students in 10th Grade:
1,107
150,499
# Students in 11th Grade:
1,061
146,819
# Students in 12th Grade:
1,050
144,755
# Ungraded Students:
-
12
District Revenue and Spending
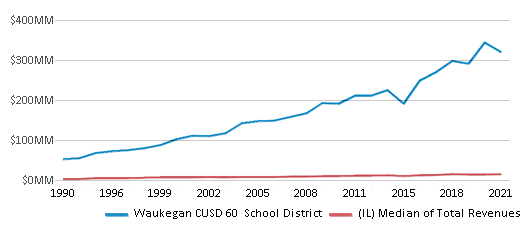
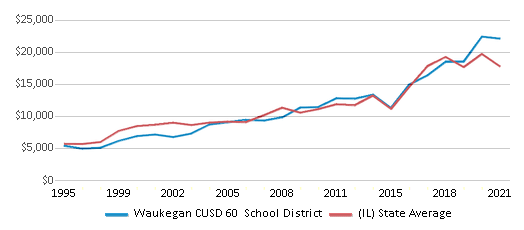
The revenue/student of $23,391 is higher than the state median of $21,990. The school district revenue/student has grown by 5% over four school years.
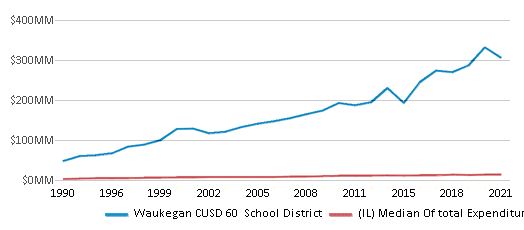
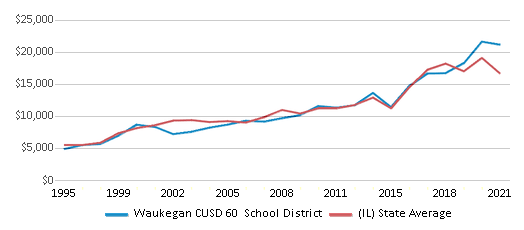
The school district's spending/student of $22,378 is higher than the state median of $21,244. The school district spending/student has grown by 5% over four school years.
Total Revenue
$320 MM
$41,381 MM
Spending
$306 MM
$39,976 MM
Revenue / Student
$23,391
$21,990
Spending / Student
$22,378
$21,244
Best Waukegan CUSD 60 School District Public Schools (2025)
School
(Math and Reading Proficiency)
(Math and Reading Proficiency)
Location
Grades
Students
Rank: #11.
Little Fort Elementary School
Rank:
6/
Top 50%10
1775 Blanchard Rd
Waukegan, IL 60087
(224) 303-3700
Waukegan, IL 60087
(224) 303-3700
Grades: K-5
| 412 students
Rank: #22.
H R Mccall Elementary School
Rank:
5/
Bottom 50%10
3215 N Mcaree Rd
Waukegan, IL 60087
(224) 303-1760
Waukegan, IL 60087
(224) 303-1760
Grades: K-5
| 378 students
Rank: #33.
Greenwood Elementary School
Rank:
5/
Bottom 50%10
1919 North Ave
Waukegan, IL 60087
(224) 303-2080
Waukegan, IL 60087
(224) 303-2080
Grades: PK-5
| 312 students
Rank: #44.
John S Clark Elementary School
Rank:
4/
Bottom 50%10
601 Blanchard Rd
Waukegan, IL 60087
(224) 303-1570
Waukegan, IL 60087
(224) 303-1570
Grades: K-5
| 240 students
Rank: #55.
Andrew Cooke Magnet Elementary School
Magnet School
Rank:
4/
Bottom 50%10
522 Belvidere Rd
Waukegan, IL 60085
(224) 303-1700
Waukegan, IL 60085
(224) 303-1700
Grades: K-5
| 370 students
Rank: #66.
John R Lewis Middle School
Rank:
4/
Bottom 50%10
600 S Lewis Ave
Waukegan, IL 60085
(224) 303-2560
Waukegan, IL 60085
(224) 303-2560
Grades: 6-8
| 762 students
Rank: #77.
Oakdale Elementary School
Rank:
3/
Bottom 50%10
2230 N Mcaree Rd
Waukegan, IL 60087
(224) 303-1860
Waukegan, IL 60087
(224) 303-1860
Grades: PK-5
| 466 students
Rank: #88.
Clearview Elementary School
Rank:
2/
Bottom 50%10
1700 Delaware Rd
Waukegan, IL 60087
(224) 303-1600
Waukegan, IL 60087
(224) 303-1600
Grades: PK-5
| 414 students
Rank: #99.
Hyde Park Elementary School
Rank:
2/
Bottom 50%10
1525 Hyde Park Ave
Waukegan, IL 60085
(224) 303-1970
Waukegan, IL 60085
(224) 303-1970
Grades: K-5
| 270 students
Rank: #1010.
Edith M Smith Middle School
Rank:
2/
Bottom 50%10
930 New York St
Waukegan, IL 60085
(224) 303-2760
Waukegan, IL 60085
(224) 303-2760
Grades: 6-8
| 489 students
Rank: #1111.
Glen Flora Elementary School
Rank:
2/
Bottom 50%10
1110 Chestnut St
Waukegan, IL 60085
(224) 303-1800
Waukegan, IL 60085
(224) 303-1800
Grades: K-5
| 458 students
Rank: #1212.
Jack Benny Middle School
Rank:
2/
Bottom 50%10
1401 Montesano Ave
Waukegan, IL 60087
(224) 303-2470
Waukegan, IL 60087
(224) 303-2470
Grades: 6-8
| 506 students
Rank: #1313.
Lyon Magnet Elementary School
Magnet School
Rank:
2/
Bottom 50%10
800 S Elmwood Ave
Waukegan, IL 60085
(224) 303-2300
Waukegan, IL 60085
(224) 303-2300
Grades: K-5
| 471 students
Rank: #1414.
Whittier Elementary School
Rank:
2/
Bottom 50%10
901 N Lewis Ave
Waukegan, IL 60085
(224) 303-1900
Waukegan, IL 60085
(224) 303-1900
Grades: K-5
| 416 students
Rank: #1515.
Glenwood Elementary School
Rank:
1/
Bottom 50%10
2500 Northmoor Ave
Waukegan, IL 60085
(224) 303-2010
Waukegan, IL 60085
(224) 303-2010
Grades: K-5
| 588 students
Rank: #1616.
Carman-buckner Elementary School
Rank:
1/
Bottom 50%10
520 Helmholz Ave
Waukegan, IL 60085
(224) 303-1500
Waukegan, IL 60085
(224) 303-1500
Grades: PK-5
| 485 students
Rank: #1717.
North Elementary School
Rank:
1/
Bottom 50%10
410 Franklin St
Waukegan, IL 60085
(224) 303-2160
Waukegan, IL 60085
(224) 303-2160
Grades: PK-5
| 473 students
Rank: #1818.
Waukegan High School
Rank:
1/
Bottom 50%10
1011 Washington St
Waukegan, IL 60085
(224) 303-3000
Waukegan, IL 60085
(224) 303-3000
Grades: 9-12
| 4,325 students
Rank: #1919.
Washington Elementary School
Rank:
1/
Bottom 50%10
110 S Orchard Ave
Waukegan, IL 60085
(224) 303-2220
Waukegan, IL 60085
(224) 303-2220
Grades: K-5
| 368 students
Rank: #2020.
Robert E Abbott Middle School
Rank:
1/
Bottom 50%10
1319 Washington St
Waukegan, IL 60085
(224) 303-2360
Waukegan, IL 60085
(224) 303-2360
Grades: 6-8
| 585 students
Rank: #2121.
Miguel Juarez Middle School
Rank:
1/
Bottom 50%10
201 N Butrick St
Waukegan, IL 60085
(224) 303-2660
Waukegan, IL 60085
(224) 303-2660
Grades: 6-8
| 662 students
Rank: n/an/a
1721 N Mcaree Rd
Waukegan, IL 60085
(224) 303-1400
Waukegan, IL 60085
(224) 303-1400
Grades: PK
| 216 students
Frequently Asked Questions
How many schools belong to Waukegan CUSD 60 School District?
Waukegan CUSD 60 School District manages 22 public schools serving 13,666 students.
What is the rank of Waukegan CUSD 60 School District?
Waukegan CUSD 60 School District is ranked #815 out of 844 school districts in Illinois (bottom 50%) based off of combined math and reading proficiency testing data for the 2020-2021 school year. This district ranks in the top 20% of Illinois school districts for: Largest student body (number of students) (Top 1%)
What is the racial composition of students in Waukegan CUSD 60 School District?
81% of Waukegan CUSD 60 School District students are Hispanic, 12% of students are Black, 3% of students are White, 2% of students are Two or more races, 1% of students are American Indian, and 1% of students are Asian.
What is the student/teacher ratio of Waukegan CUSD 60 School District?
Waukegan CUSD 60 School District has a student/teacher ratio of 15:1, which is higher than the Illinois state average of 14:1.
What is Waukegan CUSD 60 School District's spending/student ratio?
The school district's spending/student of $22,378 is higher than the state median of $21,244. The school district spending/student has grown by 5% over four school years.
Recent Articles

Year-Round Or Traditional Schedule?
Which is more appropriate for your child? A year-round attendance schedule or traditional schedule? We look at the pros and cons.

Why You Should Encourage Your Child to Join a Sports Team
Participating in team sports has a great many benefits for children, there is no doubt. In this article you will learn what those benefits are.

White Students are Now the Minority in U.S. Public Schools
Increasing birth rates among immigrant families from Asia and Central and South America, combined with lower birth rates among white families, means that for the first time in history, public school students in the United States are majority-minority. This shift in demographics poses difficulties for schools as they work to accommodate children of varying language abilities and socio-economic backgrounds.


