Top Rankings
Bardstown Independent School District ranks among the top 20% of public school district in Kentucky for:
Category
Attribute
Diversity
Most diverse schools (Top 1%)
For the 2025 school year, there are 2 public middle schools serving 594 students in Bardstown Independent School District. This district's average middle testing ranking is 7/10, which is in the top 50% of public middle schools in Kentucky.
Public Middle Schools in Bardstown Independent School District have an average math proficiency score of 40% (versus the Kentucky public middle school average of 37%), and reading proficiency score of 46% (versus the 44% statewide average).
Minority enrollment is 31% of the student body (majority Black and Hispanic), which is more than the Kentucky public middle school average of 26% (majority Black and Hispanic).
Overview
This School District
This State (KY)
# Schools
6 Schools
553 Schools
# Students
2,778 Students
177,241 Students
# Teachers
172 Teachers
11,979 Teachers
Student : Teacher Ratio
16:1
16:1
District Rank
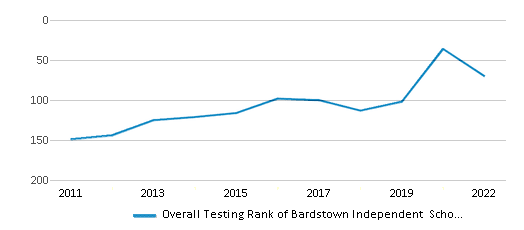
Bardstown Independent School District, which is ranked within the top 50% of all 171 school districts in Kentucky (based off of combined math and reading proficiency testing data) for the 2021-2022 school year.
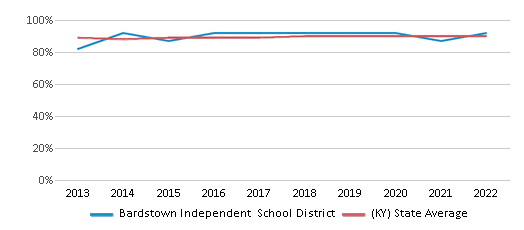
The school district's graduation rate of 90-94% has stayed relatively flat over five school years.
Overall District Rank
#70 out of 172 school districts
(Top 50%)
(Top 50%)
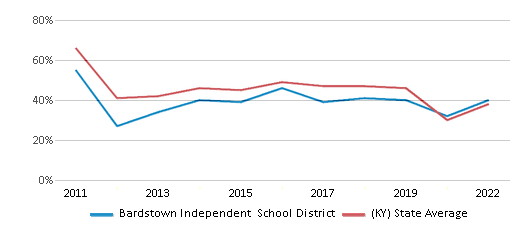
Math Test Scores (% Proficient)
40%
38%
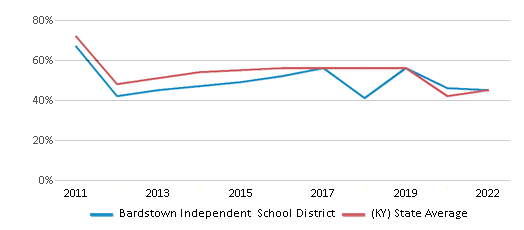
Reading/Language Arts Test Scores (% Proficient)
45%
45%
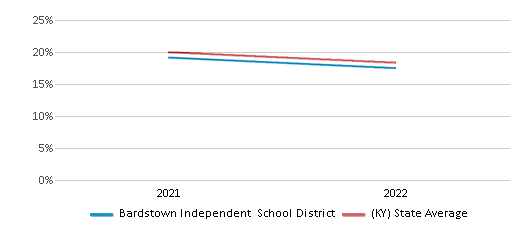
Science Test Scores (% Proficient)
21%
22%
Graduation Rate
90-94%
90%
Students by Ethnicity:
Diversity Score
0.54
0.43
# American Indian Students
4 Students
223 Students
% American Indian Students
n/a
n/a
# Asian Students
42 Students
3,079 Students
% Asian Students
1%
2%
# Hispanic Students
218 Students
15,325 Students
% Hispanic Students
8%
9%
# Black Students
326 Students
18,293 Students
% Black Students
12%
10%
# White Students
1,822 Students
131,487 Students
% White Students
66%
74%
# Hawaiian Students
3 Students
285 Students
% Hawaiian Students
n/a
n/a
# Two or more races Students
363 Students
8,549 Students
% of Two or more races Students
13%
5%
Students by Grade:
# Students in PK Grade:
267
2,141
# Students in K Grade:
203
3,545
# Students in 1st Grade:
203
3,589
# Students in 2nd Grade:
201
3,684
# Students in 3rd Grade:
226
3,450
# Students in 4th Grade:
203
3,641
# Students in 5th Grade:
213
4,688
# Students in 6th Grade:
181
38,146
# Students in 7th Grade:
192
47,664
# Students in 8th Grade:
186
48,371
# Students in 9th Grade:
202
4,884
# Students in 10th Grade:
194
4,651
# Students in 11th Grade:
160
4,668
# Students in 12th Grade:
143
4,060
# Ungraded Students:
4
59
District Revenue and Spending
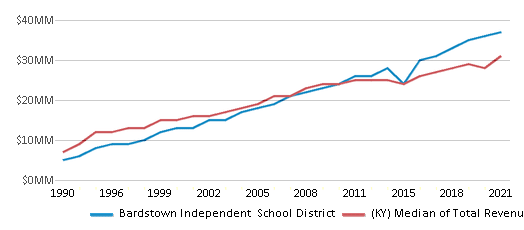
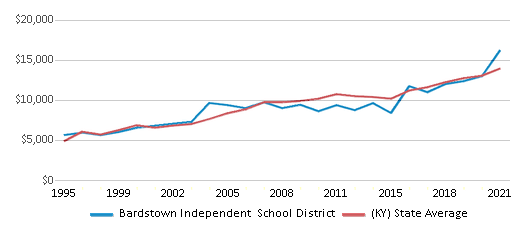
The revenue/student of $13,497 in this school district is less than the state median of $14,242. The school district revenue/student has stayed relatively flat over four school years.
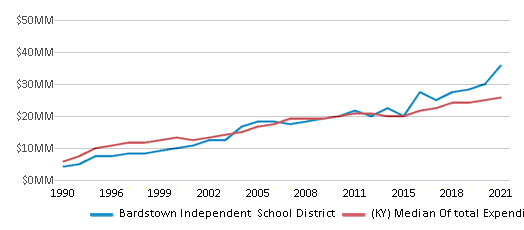
The school district's spending/student of $15,491 is higher than the state median of $13,981. The school district spending/student has stayed relatively flat over four school years.
Total Revenue
$38 MM
$9,360 MM
Spending
$43 MM
$9,189 MM
Revenue / Student
$13,497
$14,242
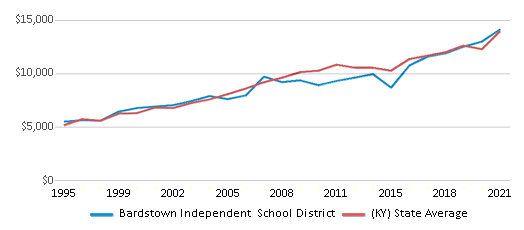
Spending / Student
$15,491
$13,981
Best Bardstown Independent School District Public Middle Schools (2025)
School
(Math and Reading Proficiency)
(Math and Reading Proficiency)
Location
Grades
Students
Rank: #11.
Bardstown Middle School
(Math: 41% | Reading: 47%)
Rank:
Rank:
7/
Top 50%10
410 N 5th St
Bardstown, KY 40004
(502) 331-8803
Bardstown, KY 40004
(502) 331-8803
Grades: 6-8
| 557 students
Rank: #22.
Bardstown Alternative School
Alternative School
(Math: ≤20% | Reading: ≤20%)
Rank:
Rank:
2/
Bottom 50%10
1345 Templin Av
Bardstown, KY 40004
(502) 331-8829
Bardstown, KY 40004
(502) 331-8829
Grades: K-12
| 37 students
Recent Articles

Year-Round Or Traditional Schedule?
Which is more appropriate for your child? A year-round attendance schedule or traditional schedule? We look at the pros and cons.

Why You Should Encourage Your Child to Join a Sports Team
Participating in team sports has a great many benefits for children, there is no doubt. In this article you will learn what those benefits are.

White Students are Now the Minority in U.S. Public Schools
Increasing birth rates among immigrant families from Asia and Central and South America, combined with lower birth rates among white families, means that for the first time in history, public school students in the United States are majority-minority. This shift in demographics poses difficulties for schools as they work to accommodate children of varying language abilities and socio-economic backgrounds.


