Top Rankings
Boone County School District ranks among the top 20% of public school district in Kentucky for:
Category
Attribute
Overall Rank
Highest overall rank (Top 10%)
Math Proficiency
Highest math proficiency (Top 10%)
Reading/Language Arts Proficiency
Highest reading/language arts proficiency (Top 20%)
Science Proficiency
Highest science proficiency (Top 20%)
Diversity
Most diverse schools (Top 1%)
Community Size
Largest student body (number of students) (Top 1%)
For the 2025 school year, there are 28 public schools serving 20,356 students in Boone County School District. This district's average testing ranking is 10/10, which is in the top 10% of public schools in Kentucky.
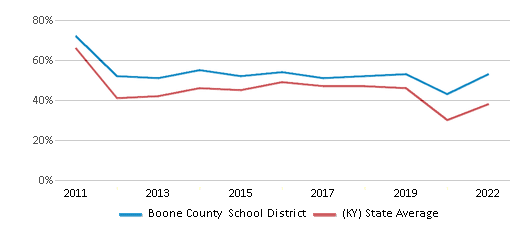
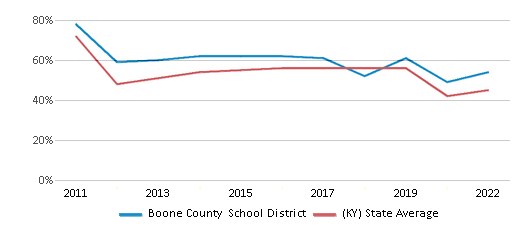
Public Schools in Boone County School District have an average math proficiency score of 53% (versus the Kentucky public school average of 38%), and reading proficiency score of 54% (versus the 45% statewide average).
The top ranked public schools in Boone County School District are Erpenbeck Elementary School, New Haven Elementary School and Longbranch Elementary School. Overall testing rank is based on a school's combined math and reading proficiency test score ranking. Boone County School District has one of the highest concentrations of top ranked public schools in Kentucky.
Minority enrollment is 28% of the student body (majority Hispanic), which is equal to the Kentucky public school average of 28% (majority Black and Hispanic).
Overview
This School District
This State (KY)
# Schools
28 Schools
1,537 Schools
# Students
20,356 Students
657,239 Students
# Teachers
1,317 Teachers
43,057 Teachers
Student : Teacher Ratio
15:1
15:1
District Rank
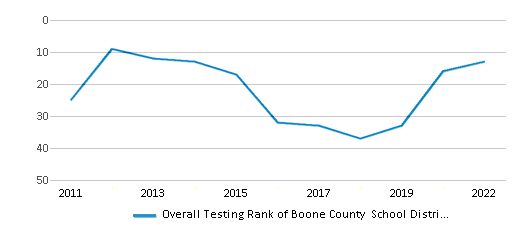
Boone County School District, which is ranked within the top 10% of all 171 school districts in Kentucky (based off of combined math and reading proficiency testing data) for the 2021-2022 school year.
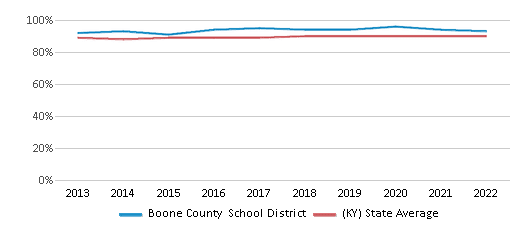
The school district's graduation rate of 93% has decreased from 95% over five school years.
Overall District Rank
#13 out of 172 school districts
(Top 10%)
(Top 10%)
Math Test Scores (% Proficient)
53%
38%
Reading/Language Arts Test Scores (% Proficient)
54%
45%
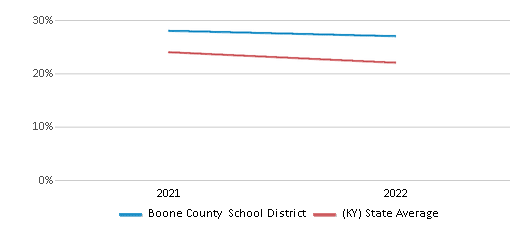
Science Test Scores (% Proficient)
27%
22%
Graduation Rate
93%
90%
Students by Ethnicity:
Diversity Score
0.46
0.46
# American Indian Students
12 Students
877 Students
% American Indian Students
n/a
n/a
# Asian Students
560 Students
13,629 Students
% Asian Students
3%
2%
# Hispanic Students
2,338 Students
62,748 Students
% Hispanic Students
11%
10%
# Black Students
1,537 Students
70,340 Students
% Black Students
8%
11%
# White Students
14,719 Students
473,486 Students
% White Students
72%
72%
# Hawaiian Students
129 Students
1,217 Students
% Hawaiian Students
1%
n/a
# Two or more races Students
1,061 Students
34,942 Students
% of Two or more races Students
5%
5%
Students by Grade:
# Students in PK Grade:
450
25,534
# Students in K Grade:
1,460
47,468
# Students in 1st Grade:
1,474
49,074
# Students in 2nd Grade:
1,477
50,429
# Students in 3rd Grade:
1,455
46,939
# Students in 4th Grade:
1,516
47,705
# Students in 5th Grade:
1,563
48,100
# Students in 6th Grade:
1,391
44,625
# Students in 7th Grade:
1,546
47,664
# Students in 8th Grade:
1,575
48,371
# Students in 9th Grade:
1,735
54,031
# Students in 10th Grade:
1,656
52,525
# Students in 11th Grade:
1,555
49,600
# Students in 12th Grade:
1,480
44,556
# Ungraded Students:
23
618
District Revenue and Spending
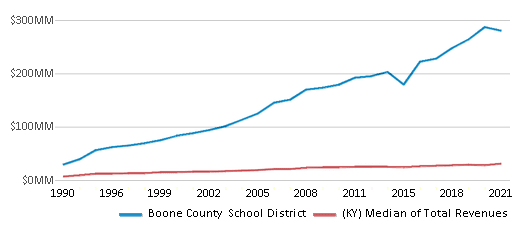
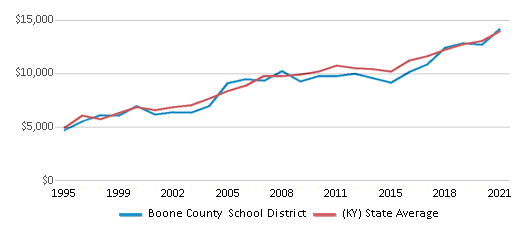
The revenue/student of $13,742 in this school district is less than the state median of $14,242. The school district revenue/student has stayed relatively flat over four school years.
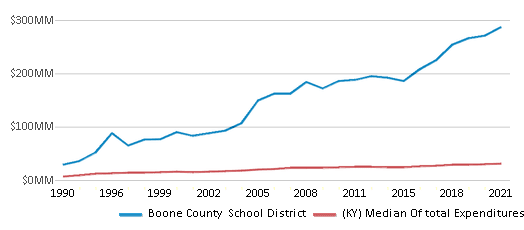
The school district's spending/student of $14,102 is higher than the state median of $13,981. The school district spending/student has stayed relatively flat over four school years.
Total Revenue
$280 MM
$9,360 MM
Spending
$287 MM
$9,189 MM
Revenue / Student
$13,742
$14,242
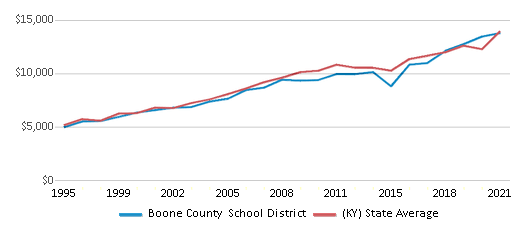
Spending / Student
$14,102
$13,981
Best Boone County School District Public Schools (2025)
School
(Math and Reading Proficiency)
(Math and Reading Proficiency)
Location
Grades
Students
Rank: #1 - 21. - 2.
Erpenbeck Elementary School
(Math: 73% | Reading: 70%)
Rank:
Rank:
10/
Top 5%10
Us 42 9001 Wetherington Blvd
Florence, KY 41042
(859) 384-7200
Florence, KY 41042
(859) 384-7200
Grades: PK-5
| 764 students
Rank: #1 - 21. - 2.
New Haven Elementary School
(Math: 72% | Reading: 71%)
Rank:
Rank:
10/
Top 5%10
10854 Us 42
Union, KY 41091
(859) 384-5325
Union, KY 41091
(859) 384-5325
Grades: PK-5
| 696 students
Rank: #33.
Longbranch Elementary School
(Math: 73% | Reading: 68%)
Rank:
Rank:
10/
Top 5%10
2805 Longbranch Rd.
Union, KY 41091
(859) 384-4500
Union, KY 41091
(859) 384-4500
Grades: PK-5
| 933 students
Rank: #44.
Shirley Mann Elementary School
(Math: 65% | Reading: 68%)
Rank:
Rank:
10/
Top 5%10
10435 Us Hwy 42
Union, KY 41091
(859) 384-5000
Union, KY 41091
(859) 384-5000
Grades: PK-5
| 744 students
Rank: #55.
Thornwilde Elementary School
(Math: 65% | Reading: 67%)
Rank:
Rank:
10/
Top 5%10
1760 Elmburn Ln
Hebron, KY 41048
(859) 283-1003
Hebron, KY 41048
(859) 283-1003
Grades: PK-5
| 669 students
Rank: #66.
Gray Middle School
(Math: 71% | Reading: 64%)
Rank:
Rank:
10/
Top 5%10
10400 Us 42
Union, KY 41091
(859) 384-5333
Union, KY 41091
(859) 384-5333
Grades: 6-8
| 1,007 students
Rank: #77.
Conner Middle School
(Math: 68% | Reading: 63%)
Rank:
Rank:
10/
Top 5%10
3300 Cougar Path
Hebron, KY 41048
(859) 334-4410
Hebron, KY 41048
(859) 334-4410
Grades: 6-8
| 860 students
Rank: #88.
North Pointe Elementary School
(Math: 62% | Reading: 65%)
Rank:
Rank:
10/
Top 5%10
875 North Bend Rd
Hebron, KY 41048
(859) 334-7000
Hebron, KY 41048
(859) 334-7000
Grades: PK-5
| 429 students
Rank: #99.
Charles H. Kelly Elementary School
(Math: 50-54% | Reading: 60-64%)
Rank:
Rank:
10/
Top 10%10
6775 Mcville Rd
Burlington, KY 41005
(859) 334-4450
Burlington, KY 41005
(859) 334-4450
Grades: PK-5
| 254 students
Rank: #1010.
Burlington Elementary School
(Math: 60% | Reading: 56%)
Rank:
Rank:
9/
Top 20%10
5946 Orient St
Burlington, KY 41005
(859) 334-4440
Burlington, KY 41005
(859) 334-4440
Grades: PK-5
| 661 students
Rank: #1111.
Ballyshannon Middle School
(Math: 58% | Reading: 54%)
Rank:
Rank:
9/
Top 20%10
7515 Shamrock Avenue
Union, KY 41091
(859) 905-2620
Union, KY 41091
(859) 905-2620
Grades: 6-8
| 614 students
Rank: #1212.
Larry A. Ryle High School
(Math: 50% | Reading: 58%)
Rank:
Rank:
9/
Top 20%10
10379 Us 42
Union, KY 41091
(859) 384-5300
Union, KY 41091
(859) 384-5300
Grades: 9-12
| 2,062 students
Rank: #1313.
Chester Goodridge Elementary School
(Math: 53% | Reading: 55%)
Rank:
Rank:
9/
Top 20%10
3330 Cougar Path
Hebron, KY 41048
(859) 334-4420
Hebron, KY 41048
(859) 334-4420
Grades: PK-5
| 674 students
Rank: #1414.
Stephens Elementary School
(Math: 51% | Reading: 55%)
Rank:
Rank:
9/
Top 20%10
5687 Hwy 237
Burlington, KY 41005
(859) 334-4460
Burlington, KY 41005
(859) 334-4460
Grades: PK-5
| 605 students
Rank: #1515.
Randall K. Cooper High School
(Math: 50% | Reading: 55%)
Rank:
Rank:
9/
Top 20%10
2855 Longbranch Rd
Union, KY 41091
(859) 384-5040
Union, KY 41091
(859) 384-5040
Grades: 9-12
| 1,485 students
Rank: #1616.
Conner High School
(Math: 50% | Reading: 53%)
Rank:
Rank:
9/
Top 20%10
3310 Cougar Path
Hebron, KY 41048
(859) 334-4400
Hebron, KY 41048
(859) 334-4400
Grades: 9-12
| 1,413 students
Rank: #1717.
A M Yealey Elementary School
(Math: 43% | Reading: 50%)
Rank:
Rank:
7/
Top 50%10
10 Yealey Dr
Florence, KY 41042
(859) 282-3333
Florence, KY 41042
(859) 282-3333
Grades: PK-5
| 576 students
Rank: #1818.
Steeplechase Elementary School
(Math: 46% | Reading: 49%)
Rank:
Rank:
7/
Top 50%10
472 Chambers Road
Walton, KY 41094
(859) 485-3500
Walton, KY 41094
(859) 485-3500
Grades: PK-5
| 580 students
Rank: #1919.
Ockerman Middle School
(Math: 45% | Reading: 49%)
Rank:
Rank:
7/
Top 50%10
8300 Us 42
Florence, KY 41042
(859) 282-3240
Florence, KY 41042
(859) 282-3240
Grades: 6-8
| 631 students
Rank: #2020.
Accel Academy
Alternative School
(Math: 30-34% | Reading: 55-59%)
Rank:
Rank:
7/
Top 50%10
3300 Barney Road
Burlington, KY 41005
(859) 283-3250
Burlington, KY 41005
(859) 283-3250
Grades: 6-12
| 168 students
Rank: #21 - 2221. - 22.
Camp Ernst Middle School
(Math: 38% | Reading: 46%)
Rank:
Rank:
6/
Top 50%10
6515 Camp Ernst Rd
Burlington, KY 41005
(859) 534-4000
Burlington, KY 41005
(859) 534-4000
Grades: 6-8
| 704 students
Rank: #21 - 2221. - 22.
Florence Elementary School
(Math: 38% | Reading: 46%)
Rank:
Rank:
6/
Top 50%10
103 Center St
Florence, KY 41042
(859) 282-2610
Florence, KY 41042
(859) 282-2610
Grades: PK-5
| 577 students
Rank: #2323.
Boone County High School
(Math: 38% | Reading: 42%)
Rank:
Rank:
5/
Bottom 50%10
7056 Burlington Pk
Florence, KY 41042
(859) 282-5655
Florence, KY 41042
(859) 282-5655
Grades: 9-12
| 1,299 students
Rank: #2424.
Ockerman Elementary School
(Math: 34% | Reading: 39%)
Rank:
Rank:
4/
Bottom 50%10
8250 Us 42
Florence, KY 41042
(859) 282-4620
Florence, KY 41042
(859) 282-4620
Grades: PK-5
| 706 students
Rank: #2525.
Hillard Collins Elementary School
(Math: 31% | Reading: 39%)
Rank:
Rank:
4/
Bottom 50%10
9000 Spruce Dr
Florence, KY 41042
(859) 282-2350
Florence, KY 41042
(859) 282-2350
Grades: PK-5
| 527 students
Rank: #2626.
Rector A. Jones Middle School
(Math: 23% | Reading: 26%)
Rank:
Rank:
2/
Bottom 50%10
8000 Spruce Dr
Florence, KY 41042
(859) 282-4610
Florence, KY 41042
(859) 282-4610
Grades: 6-8
| 674 students
Rank: #2727.
Rise Academy
Alternative School
(Math: ≤10% | Reading: ≤10%)
Rank:
Rank:
1/
Bottom 50%10
99 Center Dr.
Florence, KY 41042
(859) 283-1003
Florence, KY 41042
(859) 283-1003
Grades: 6-12
| 44 students
Rank: n/an/a
Ignite Institute
Vocational School
37 Atlantic Avenue
Erlanger, KY 41018
(859) 817-3570
Erlanger, KY 41018
(859) 817-3570
Grades: 9-12
| n/a students
Frequently Asked Questions
How many schools belong to Boone County School District?
Boone County School District manages 28 public schools serving 20,356 students.
What is the rank of Boone County School District?
Boone County School District is ranked #14 out of 171 school districts in Kentucky (top 10%) based off of combined math and reading proficiency testing data for the 2021-2022 school year. This district ranks in the top 20% of Kentucky school districts for: Highest overall rank (Top 10%), Highest math proficiency (Top 10%), Highest reading/language arts proficiency (Top 20%), Highest science proficiency (Top 20%), Most diverse schools (Top 1%) and Largest student body (number of students) (Top 1%)
What is the racial composition of students in Boone County School District?
72% of Boone County School District students are White, 11% of students are Hispanic, 8% of students are Black, 5% of students are Two or more races, 3% of students are Asian, and 1% of students are Hawaiian.
What is the student/teacher ratio of Boone County School District?
Boone County School District has a student/teacher ratio of 15:1, which is equal to the Kentucky state average of 15:1.
What is Boone County School District's spending/student ratio?
The school district's spending/student of $14,102 is higher than the state median of $13,981. The school district spending/student has stayed relatively flat over four school years.
Recent Articles

Year-Round Or Traditional Schedule?
Which is more appropriate for your child? A year-round attendance schedule or traditional schedule? We look at the pros and cons.

Why You Should Encourage Your Child to Join a Sports Team
Participating in team sports has a great many benefits for children, there is no doubt. In this article you will learn what those benefits are.

White Students are Now the Minority in U.S. Public Schools
Increasing birth rates among immigrant families from Asia and Central and South America, combined with lower birth rates among white families, means that for the first time in history, public school students in the United States are majority-minority. This shift in demographics poses difficulties for schools as they work to accommodate children of varying language abilities and socio-economic backgrounds.


