Top Rankings
Springfield School District ranks among the top 20% of public school district in Massachusetts for:
Category
Attribute
Community Size
Largest student body (number of students) (Top 1%)
For the 2025 school year, there are 34 public preschools serving 11,988 students in Springfield School District. This district's average pre testing ranking is 1/10, which is in the bottom 50% of public pre schools in Massachusetts.
Public Preschools in Springfield School District have an average math proficiency score of 20% (versus the Massachusetts public pre school average of 34%), and reading proficiency score of 24% (versus the 37% statewide average).
Minority enrollment is 92% of the student body (majority Hispanic), which is more than the Massachusetts public preschool average of 53% (majority Hispanic).
Overview
This School District
This State (MA)
# Schools
67 Schools
567 Schools
# Students
23,914 Students
205,303 Students
# Teachers
2,186 Teachers
17,796 Teachers
Student : Teacher Ratio
11:1
11:1
District Rank
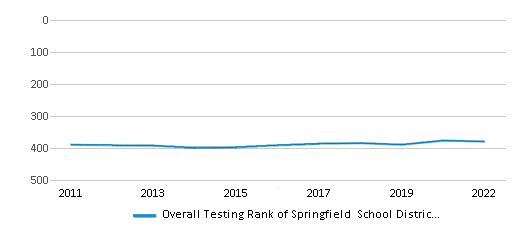
Springfield School District, which is ranked within the bottom 50% of all 393 school districts in Massachusetts (based off of combined math and reading proficiency testing data) for the 2021-2022 school year.
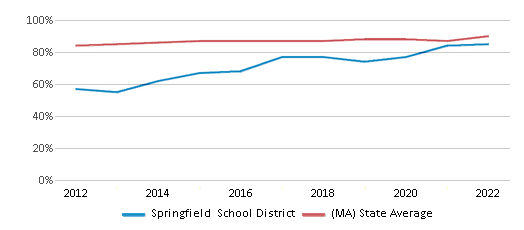
The school district's graduation rate of 85% has increased from 77% over five school years.
Overall District Rank
#379 out of 397 school districts
(Bottom 50%)
(Bottom 50%)
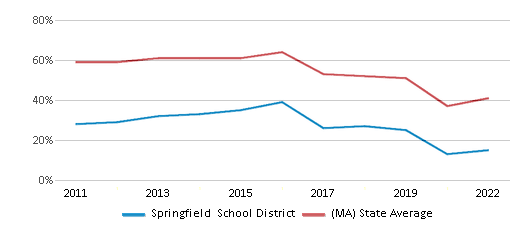
Math Test Scores (% Proficient)
15%
41%
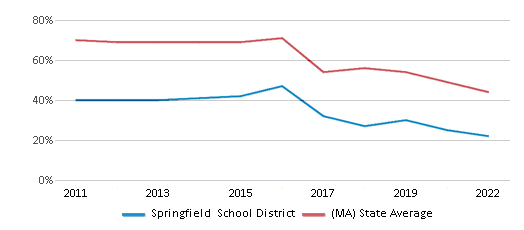
Reading/Language Arts Test Scores (% Proficient)
22%
44%
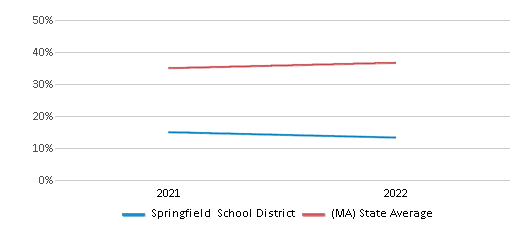
Science Test Scores (% Proficient)
16%
44%
Graduation Rate
85%
90%
Students by Ethnicity:
Diversity Score
0.49
0.68
# American Indian Students
26 Students
495 Students
% American Indian Students
n/a
n/a
# Asian Students
414 Students
11,779 Students
% Asian Students
2%
6%
# Hispanic Students
16,545 Students
61,622 Students
% Hispanic Students
69%
30%
# Black Students
4,205 Students
25,280 Students
% Black Students
18%
12%
# White Students
1,875 Students
95,698 Students
% White Students
8%
47%
# Hawaiian Students
6 Students
173 Students
% Hawaiian Students
n/a
n/a
# Two or more races Students
820 Students
10,168 Students
% of Two or more races Students
3%
5%
Students by Grade:
# Students in PK Grade:
1,914
31,316
# Students in K Grade:
1,647
33,369
# Students in 1st Grade:
1,673
30,795
# Students in 2nd Grade:
1,702
28,908
# Students in 3rd Grade:
1,625
23,512
# Students in 4th Grade:
1,758
22,524
# Students in 5th Grade:
1,716
18,693
# Students in 6th Grade:
1,488
7,489
# Students in 7th Grade:
1,488
3,111
# Students in 8th Grade:
1,759
3,363
# Students in 9th Grade:
1,991
606
# Students in 10th Grade:
1,847
525
# Students in 11th Grade:
1,599
528
# Students in 12th Grade:
1,592
485
# Ungraded Students:
115
79
District Revenue and Spending
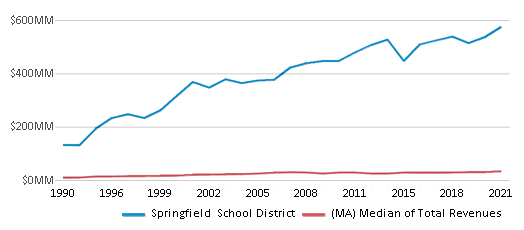
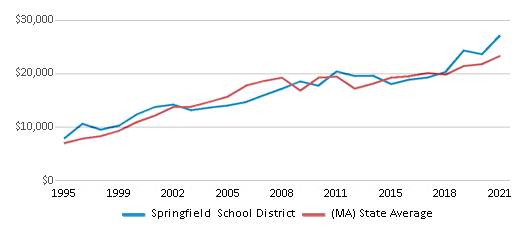
The revenue/student of $24,004 is higher than the state median of $23,845. The school district revenue/student has stayed relatively flat over four school years.
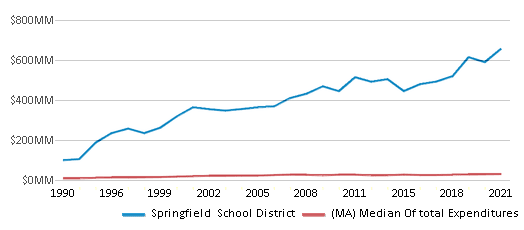
The school district's spending/student of $27,466 is higher than the state median of $24,602. The school district spending/student has stayed relatively flat over four school years.
Total Revenue
$574 MM
$21,850 MM
Spending
$657 MM
$22,544 MM
Revenue / Student
$24,004
$23,845
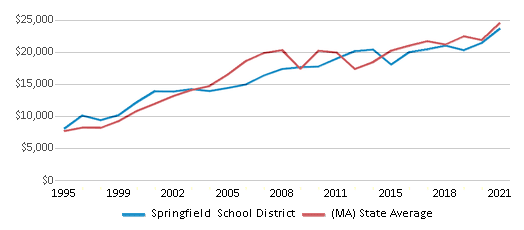
Spending / Student
$27,466
$24,602
Best Springfield School District Public Preschools (2025)
School
(Math and Reading Proficiency)
(Math and Reading Proficiency)
Location
Grades
Students
Rank: #11.
Alfred G. Zanetti Montessori Magnet School
Magnet School
(Math: 40% | Reading: 53%)
Rank:
Rank:
6/
Top 50%10
474 Armory St
Springfield, MA 01104
(413) 787-7400
Springfield, MA 01104
(413) 787-7400
Grades: PK-8
| 425 students
Rank: #2 - 32. - 3.
Mary A. Dryden Veterans Memorial School
(Math: 30-34% | Reading: 40-44%)
Rank:
Rank:
4/
Bottom 50%10
190 Surrey Rd
Springfield, MA 01118
(413) 787-7248
Springfield, MA 01118
(413) 787-7248
Grades: PK-5
| 290 students
Rank: #2 - 32. - 3.
Mary O Pottenger
(Math: 30-34% | Reading: 40-44%)
Rank:
Rank:
4/
Bottom 50%10
1435 Carew Street
Springfield, MA 01104
(413) 787-7266
Springfield, MA 01104
(413) 787-7266
Grades: PK-5
| 366 students
Rank: #44.
Benjamin Swan Elementary School
(Math: 30-34% | Reading: 30-34%)
Rank:
Rank:
4/
Bottom 50%10
680 Union Street
Springfield, MA 01109
(413) 787-7526
Springfield, MA 01109
(413) 787-7526
Grades: PK-5
| 499 students
Rank: #5 - 65. - 6.
Alice B Beal Elementary School
(Math: 20-24% | Reading: 35-39%)
Rank:
Rank:
3/
Bottom 50%10
285 Tiffany Street
Springfield, MA 01108
(413) 787-7544
Springfield, MA 01108
(413) 787-7544
Grades: PK-5
| 304 students
Rank: #5 - 65. - 6.
Frank H Freedman
(Math: 20-24% | Reading: 35-39%)
Rank:
Rank:
3/
Bottom 50%10
90 Cherokee Dr
Springfield, MA 01109
(413) 787-7443
Springfield, MA 01109
(413) 787-7443
Grades: PK-5
| 267 students
Rank: #77.
Warner
(Math: 30-34% | Reading: 25-29%)
Rank:
Rank:
3/
Bottom 50%10
493 Parker Street
Springfield, MA 01129
(413) 787-7258
Springfield, MA 01129
(413) 787-7258
Grades: PK-5
| 238 students
Rank: #88.
White Street
(Math: 25-29% | Reading: 30-34%)
Rank:
Rank:
3/
Bottom 50%10
300 White Street
Springfield, MA 01108
(413) 787-7543
Springfield, MA 01108
(413) 787-7543
Grades: PK-5
| 392 students
Rank: #99.
Frederick Harris
(Math: 29% | Reading: 27%)
Rank:
Rank:
3/
Bottom 50%10
58 Hartford Ter
Springfield, MA 01118
(413) 787-7254
Springfield, MA 01118
(413) 787-7254
Grades: PK-5
| 512 students
Rank: #10 - 1110. - 11.
Kensington International School
(Math: 15-19% | Reading: 25-29%)
Rank:
Rank:
2/
Bottom 50%10
31 Kensington Avenue
Springfield, MA 01108
(413) 787-7522
Springfield, MA 01108
(413) 787-7522
Grades: PK-5
| 262 students
Rank: #10 - 1110. - 11.
Thomas M Balliet
(Math: 15-19% | Reading: 25-29%)
Rank:
Rank:
2/
Bottom 50%10
52 Rosewell St
Springfield, MA 01109
(413) 787-7446
Springfield, MA 01109
(413) 787-7446
Grades: PK-5
| 278 students
Rank: #12 - 1312. - 13.
Mary M Walsh
(Math: 20-24% | Reading: 20-24%)
Rank:
Rank:
2/
Bottom 50%10
50 Empress Ct
Springfield, MA 01129
(413) 787-7448
Springfield, MA 01129
(413) 787-7448
Grades: PK-5
| 249 students
Rank: #12 - 1312. - 13.
Sumner Avenue
(Math: 20-24% | Reading: 20-24%)
Rank:
Rank:
2/
Bottom 50%10
45 Sumner Avenue
Springfield, MA 01108
(413) 787-7430
Springfield, MA 01108
(413) 787-7430
Grades: PK-5
| 488 students
Rank: #1414.
Edward P. Boland School
(Math: 10-14% | Reading: 25-29%)
Rank:
Rank:
2/
Bottom 50%10
426 Armory Street
Springfield, MA 01104
(413) 750-2511
Springfield, MA 01104
(413) 750-2511
Grades: PK-5
| 554 students
Rank: #1515.
Washington
(Math: 20-24% | Reading: 15-19%)
Rank:
Rank:
2/
Bottom 50%10
141 Washington Street
Springfield, MA 01108
(413) 787-7551
Springfield, MA 01108
(413) 787-7551
Grades: PK-5
| 397 students
Rank: #1616.
German Gerena Community School
(Math: 16% | Reading: 25%)
Rank:
Rank:
2/
Bottom 50%10
200 Birnie Avenue
Springfield, MA 01107
(413) 787-7320
Springfield, MA 01107
(413) 787-7320
Grades: PK-5
| 623 students
Rank: #17 - 1817. - 18.
Glenwood
(Math: 15-19% | Reading: 20-24%)
Rank:
Rank:
2/
Bottom 50%10
50 Morrison Terrace
Springfield, MA 01104
(413) 787-7527
Springfield, MA 01104
(413) 787-7527
Grades: PK-5
| 296 students
Rank: #17 - 1817. - 18.
Liberty
(Math: 15-19% | Reading: 20-24%)
Rank:
Rank:
2/
Bottom 50%10
962 Carew Street
Springfield, MA 01104
(413) 787-7299
Springfield, MA 01104
(413) 787-7299
Grades: PK-5
| 246 students
Rank: #19 - 2019. - 20.
Daniel B Brunton
(Math: 10-14% | Reading: 20-24%)
Rank:
Rank:
2/
Bottom 50%10
1801 Parker Street
Springfield, MA 01128
(413) 787-7444
Springfield, MA 01128
(413) 787-7444
Grades: PK-5
| 295 students
Rank: #19 - 2019. - 20.
Indian Orchard Elementary School
(Math: 10-14% | Reading: 20-24%)
Rank:
Rank:
2/
Bottom 50%10
95 Milton Street
Indian Orchard, MA 01151
(413) 787-7255
Indian Orchard, MA 01151
(413) 787-7255
Grades: PK-5
| 565 students
Rank: #21 - 2221. - 22.
Arthur T Talmadge
(Math: 15-19% | Reading: 15-19%)
Rank:
Rank:
1/
Bottom 50%10
1395 Allen Street
Springfield, MA 01118
(413) 787-7249
Springfield, MA 01118
(413) 787-7249
Grades: PK-5
| 224 students
Rank: #21 - 2221. - 22.
Samuel Bowles
(Math: 15-19% | Reading: 15-19%)
Rank:
Rank:
1/
Bottom 50%10
24 Bowles Park
Springfield, MA 01104
(413) 787-7334
Springfield, MA 01104
(413) 787-7334
Grades: PK-5
| 310 students
Rank: #2323.
Rebecca M Johnson
(Math: 14% | Reading: 19%)
Rank:
Rank:
1/
Bottom 50%10
55 Catherine Street
Springfield, MA 01109
(413) 787-6687
Springfield, MA 01109
(413) 787-6687
Grades: PK-5
| 595 students
Rank: #2424.
Milton Bradley School
(Math: 17% | Reading: 15%)
Rank:
Rank:
1/
Bottom 50%10
22 Mulberry Street
Springfield, MA 01105
(413) 787-7475
Springfield, MA 01105
(413) 787-7475
Grades: PK-5
| 391 students
Rank: #2525.
Elias Brookings
(Math: 15-19% | Reading: 10-14%)
Rank:
Rank:
1/
Bottom 50%10
433 Walnut Street
Springfield, MA 01105
(413) 787-7200
Springfield, MA 01105
(413) 787-7200
Grades: PK-5
| 289 students
Rank: #26 - 2826. - 28.
Brightwood
(Math: 10-14% | Reading: 15-19%)
Rank:
Rank:
1/
Bottom 50%10
255 Plainfield Street
Springfield, MA 01107
(413) 787-7238
Springfield, MA 01107
(413) 787-7238
Grades: PK-5
| 480 students
Rank: #26 - 2826. - 28.
Glickman Elementary School
(Math: 10-14% | Reading: 15-19%)
Rank:
Rank:
1/
Bottom 50%10
120 Ashland Avenue
Springfield, MA 01119
(413) 750-2756
Springfield, MA 01119
(413) 750-2756
Grades: PK-5
| 315 students
Rank: #26 - 2826. - 28.
Mary M Lynch
(Math: 10-14% | Reading: 15-19%)
Rank:
Rank:
1/
Bottom 50%10
315 No Branch Pkwy
Springfield, MA 01119
(413) 787-7250
Springfield, MA 01119
(413) 787-7250
Grades: PK-5
| 226 students
Rank: #2929.
Hiram L Dorman
(Math: 10-14% | Reading: 10-14%)
Rank:
Rank:
1/
Bottom 50%10
20 Lydia Street
Springfield, MA 01109
(413) 787-7554
Springfield, MA 01109
(413) 787-7554
Grades: PK-5
| 277 students
Rank: #3030.
Lincoln
(Math: 6-9% | Reading: 10-14%)
Rank:
Rank:
1/
Bottom 50%10
255 Plainfield Street
Springfield, MA 01107
(413) 787-7314
Springfield, MA 01107
(413) 787-7314
Grades: PK-5
| 454 students
Rank: #3131.
William N. Deberry
(Math: 6-9% | Reading: 6-9%)
Rank:
Rank:
1/
Bottom 50%10
680 Union Street
Springfield, MA 01109
(413) 787-7582
Springfield, MA 01109
(413) 787-7582
Grades: PK-5
| 424 students
Rank: n/an/a
111 Seymour Street
Springfield, MA 01109
(413) 750-2056
Springfield, MA 01109
(413) 750-2056
Grades: PK
| 131 students
Rank: n/an/a
15 Catherine Street
Springfield, MA 01109
(413) 787-7100
Springfield, MA 01109
(413) 787-7100
Grades: PK
| 188 students
Rank: n/an/a
319 Cortland Street
Springfield, MA 01109
(413) 787-7345
Springfield, MA 01109
(413) 787-7345
Grades: PK
| 138 students
Recent Articles

What Is A Charter School?
Explore the world of charter schools in this comprehensive guide. Learn about their history, how they operate, and the pros and cons of this educational innovation. Discover key facts about charter schools, including admission policies, demographics, and funding, as well as what to look for when considering a charter school for your child.

10 Reasons Why High School Sports Benefit Students
Discover the 10 compelling reasons why high school sports are beneficial for students. This comprehensive article explores how athletics enhance academic performance, foster personal growth, and develop crucial life skills. From improved fitness and time management to leadership development and community representation, learn why participating in high school sports can be a game-changer for students' overall success and well-being.

February 05, 2025
Understanding the U.S. Department of Education: Structure, Impact, and EvolutionWe explore how the Department of Education shapes American education, from its cabinet-level leadership to its impact on millions of students, written for general audiences seeking clarity on this vital institution.


