Top Rankings
Alamance-Burlington Schools School District ranks among the top 20% of public school district in North Carolina for:
Category
Attribute
Diversity
Most diverse schools (Top 1%)
Community Size
Largest student body (number of students) (Top 1%)
For the 2025 school year, there are 29 public elementary schools serving 15,163 students in Alamance-Burlington Schools School District. This district's average elementary testing ranking is 3/10, which is in the bottom 50% of public elementary schools in North Carolina.
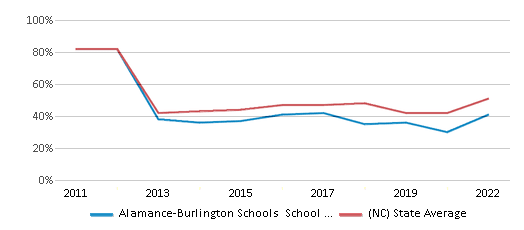
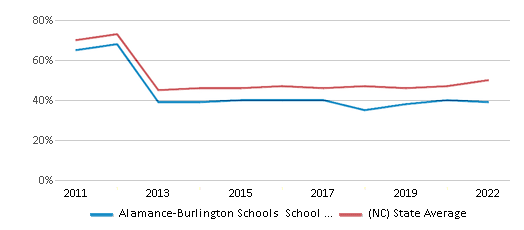
Public Elementary Schools in Alamance-Burlington Schools School District have an average math proficiency score of 40% (versus the North Carolina public elementary school average of 50%), and reading proficiency score of 37% (versus the 49% statewide average).
Minority enrollment is 66% of the student body (majority Hispanic), which is more than the North Carolina public elementary school average of 57% (majority Black and Hispanic).
Overview
This School District
This State (NC)
# Schools
38 Schools
2,174 Schools
# Students
22,477 Students
1,091,007 Students
# Teachers
1,399 Teachers
73,903 Teachers
Student : Teacher Ratio
16:1
16:1
District Rank
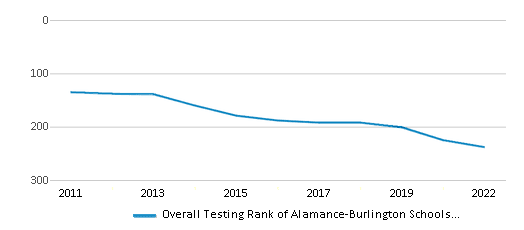
Alamance-Burlington Schools School District, which is ranked within the bottom 50% of all 320 school districts in North Carolina (based off of combined math and reading proficiency testing data) for the 2021-2022 school year.
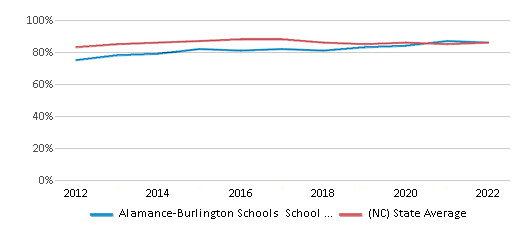
The school district's graduation rate of 86% has increased from 82% over five school years.
Overall District Rank
#238 out of 325 school districts
(Bottom 50%)
(Bottom 50%)
Math Test Scores (% Proficient)
41%
51%
Reading/Language Arts Test Scores (% Proficient)
39%
50%
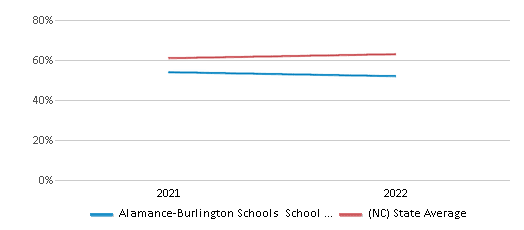
Science Test Scores (% Proficient)
52%
63%
Graduation Rate
86%
86%
Students by Ethnicity:
Diversity Score
0.72
0.72
# American Indian Students
57 Students
12,383 Students
% American Indian Students
n/a
1%
# Asian Students
392 Students
47,310 Students
% Asian Students
2%
4%
# Hispanic Students
6,948 Students
227,576 Students
% Hispanic Students
31%
21%
# Black Students
5,520 Students
268,051 Students
% Black Students
25%
25%
# White Students
7,868 Students
465,086 Students
% White Students
35%
43%
# Hawaiian Students
25 Students
1,488 Students
% Hawaiian Students
n/a
n/a
# Two or more races Students
1,667 Students
69,126 Students
% of Two or more races Students
7%
6%
Students by Grade:
# Students in PK Grade:
306
23,192
# Students in K Grade:
1,608
109,971
# Students in 1st Grade:
1,516
114,331
# Students in 2nd Grade:
1,684
118,121
# Students in 3rd Grade:
1,546
111,941
# Students in 4th Grade:
1,642
114,493
# Students in 5th Grade:
1,656
115,565
# Students in 6th Grade:
1,649
116,023
# Students in 7th Grade:
1,696
113,393
# Students in 8th Grade:
1,723
115,504
# Students in 9th Grade:
2,171
11,612
# Students in 10th Grade:
2,027
10,182
# Students in 11th Grade:
1,794
8,704
# Students in 12th Grade:
1,459
7,975
# Ungraded Students:
-
-
District Revenue and Spending
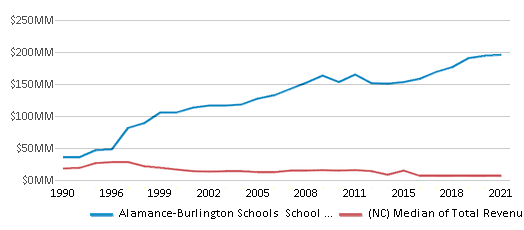
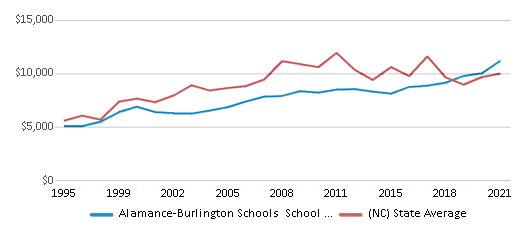
The revenue/student of $10,443 in this school district is less than the state median of $11,187. The school district revenue/student has stayed relatively flat over four school years.
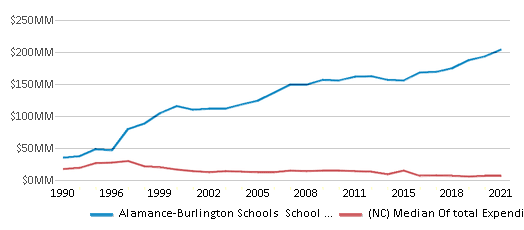
The school district's spending/student of $10,896 is less than the state median of $11,612. The school district spending/student has stayed relatively flat over four school years.
Total Revenue
$235 MM
$17,307 MM
Spending
$245 MM
$17,964 MM
Revenue / Student
$10,443
$11,187
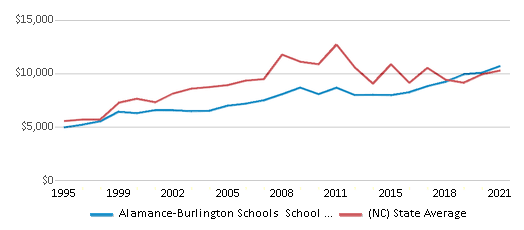
Spending / Student
$10,896
$11,612
Best Alamance-Burlington Schools School District Public Elementary Schools (2025)
School
(Math and Reading Proficiency)
(Math and Reading Proficiency)
Location
Grades
Students
Rank: #11.
Marvin B Smith Elementary School
(Math: 69% | Reading: 61%)
Rank:
Rank:
8/
Top 30%10
2235 Delaney Drive
Burlington, NC 27215
(336) 570-6140
Burlington, NC 27215
(336) 570-6140
Grades: PK-5
| 545 students
Rank: #22.
Edwin M Holt Elementary School
(Math: 57% | Reading: 54%)
Rank:
Rank:
7/
Top 50%10
4751 S Nc 62
Burlington, NC 27215
(336) 570-6420
Burlington, NC 27215
(336) 570-6420
Grades: K-5
| 486 students
Rank: #33.
South Mebane Elementary School
(Math: 62% | Reading: 50%)
Rank:
Rank:
7/
Top 50%10
600 S 3rd Street
Mebane, NC 27302
(919) 563-6905
Mebane, NC 27302
(919) 563-6905
Grades: K-5
| 547 students
Rank: #44.
Hawfields Middle School
(Math: 66% | Reading: 47%)
Rank:
Rank:
7/
Top 50%10
1951 S Nc 119
Mebane, NC 27302
(919) 563-5303
Mebane, NC 27302
(919) 563-5303
Grades: 6-8
| 822 students
Rank: #55.
E M Yoder Elementary School
(Math: 55-59% | Reading: 50-54%)
Rank:
Rank:
7/
Top 50%10
301 N Charles Street
Mebane, NC 27302
(919) 563-3722
Mebane, NC 27302
(919) 563-3722
Grades: PK-5
| 318 students
Rank: #66.
Audrey W. Garrett Elementary School
(Math: 58% | Reading: 49%)
Rank:
Rank:
6/
Top 50%10
3224 Old Hillsborough Road
Mebane, NC 27302
(919) 563-2088
Mebane, NC 27302
(919) 563-2088
Grades: PK-5
| 666 students
Rank: #77.
Altamahaw-ossipee Elementary School
(Math: 55% | Reading: 51%)
Rank:
Rank:
6/
Top 50%10
2832 N Nc 87
Elon, NC 27244
(336) 538-6030
Elon, NC 27244
(336) 538-6030
Grades: K-5
| 585 students
Rank: #88.
Highland Elementary School
(Math: 53% | Reading: 50%)
Rank:
Rank:
6/
Top 50%10
3720 Bonnar Bridge Parkway
Burlington, NC 27215
(336) 538-8700
Burlington, NC 27215
(336) 538-8700
Grades: K-5
| 630 students
Rank: #99.
Western Alamance Middle School
(Math: 57% | Reading: 46%)
Rank:
Rank:
6/
Top 50%10
2100 Eldon Drive
Elon, NC 27244
(336) 538-6010
Elon, NC 27244
(336) 538-6010
Grades: 6-8
| 894 students
Rank: #1010.
Woodlawn Middle School
(Math: 52% | Reading: 44%)
Rank:
Rank:
5/
Bottom 50%10
3970 Mebane Rogers Road
Mebane, NC 27302
(919) 563-3222
Mebane, NC 27302
(919) 563-3222
Grades: 6-8
| 739 students
Rank: #1111.
Alexander Wilson Elementary School
(Math: 49% | Reading: 46%)
Rank:
Rank:
5/
Bottom 50%10
2518 Nc 54
Graham, NC 27253
(336) 578-1366
Graham, NC 27253
(336) 578-1366
Grades: PK-5
| 602 students
Rank: #1212.
Sylvan Elementary School
(Math: 45-49% | Reading: 40-44%)
Rank:
Rank:
5/
Bottom 50%10
7718 Sylvan Road
Snow Camp, NC 27349
(336) 376-3350
Snow Camp, NC 27349
(336) 376-3350
Grades: PK-5
| 289 students
Rank: #1313.
Elon Elementary School
(Math: 46% | Reading: 43%)
Rank:
Rank:
4/
Bottom 50%10
720 Walker Road
Elon, NC 27244
(336) 538-6000
Elon, NC 27244
(336) 538-6000
Grades: K-5
| 682 students
Rank: #1414.
Southern Alamance Middle School
(Math: 44% | Reading: 42%)
Rank:
Rank:
4/
Bottom 50%10
771 Southern High Road
Graham, NC 27253
(336) 570-6500
Graham, NC 27253
(336) 570-6500
Grades: 6-8
| 861 students
Rank: #1515.
Pleasant Grove Elementary School
(Math: 40-44% | Reading: 35-39%)
Rank:
Rank:
4/
Bottom 50%10
2847 Pleasant Grv Sch Road
Burlington, NC 27217
(336) 421-3701
Burlington, NC 27217
(336) 421-3701
Grades: PK-5
| 282 students
Rank: #1616.
South Graham Elementary School
(Math: 37% | Reading: 35%)
Rank:
Rank:
3/
Bottom 50%10
320 Ivey Road
Graham, NC 27253
(336) 570-6520
Graham, NC 27253
(336) 570-6520
Grades: PK-5
| 493 students
Rank: #1717.
Alamance Virtual School
(Math: 27% | Reading: 41%)
Rank:
Rank:
3/
Bottom 50%10
612 Apple Street
Burlington, NC 27217
(336) 570-6134
Burlington, NC 27217
(336) 570-6134
Grades: 4-12
| 234 students
Rank: #1818.
B. Everett Jordan Elementary School
(Math: 30-34% | Reading: 30-34%)
Rank:
Rank:
2/
Bottom 50%10
5827 Church Road
Graham, NC 27253
(336) 376-3673
Graham, NC 27253
(336) 376-3673
Grades: K-5
| 343 students
Rank: #1919.
R Homer Andrews Elementary School
(Math: 27% | Reading: 32%)
Rank:
Rank:
2/
Bottom 50%10
2630 Buckingham Road
Burlington, NC 27217
(336) 570-6170
Burlington, NC 27217
(336) 570-6170
Grades: PK-5
| 535 students
Rank: #2020.
Turrentine Middle School
(Math: 25% | Reading: 33%)
Rank:
Rank:
2/
Bottom 50%10
1710 Edgewood Avenue
Burlington, NC 27215
(336) 570-6150
Burlington, NC 27215
(336) 570-6150
Grades: 6-8
| 687 students
Rank: #2121.
Eastlawn Elementary School
(Math: 26% | Reading: 23%)
Rank:
Rank:
1/
Bottom 50%10
502 N Graham Hopedale Road
Burlington, NC 27217
(336) 570-6180
Burlington, NC 27217
(336) 570-6180
Grades: PK-5
| 555 students
Rank: #2222.
Grove Park Elementary School
(Math: 25% | Reading: 24%)
Rank:
Rank:
1/
Bottom 50%10
141 Trail One
Burlington, NC 27215
(336) 570-6115
Burlington, NC 27215
(336) 570-6115
Grades: PK-5
| 407 students
Rank: #2323.
Hillcrest Elementary School
(Math: 22% | Reading: 25%)
Rank:
Rank:
1/
Bottom 50%10
1714 W Davis Street
Burlington, NC 27215
(336) 570-6120
Burlington, NC 27215
(336) 570-6120
Grades: PK-5
| 522 students
Rank: #2424.
North Graham Elementary School
(Math: 20-24% | Reading: 20-24%)
Rank:
Rank:
1/
Bottom 50%10
1025 Trollinger Road
Graham, NC 27253
(336) 578-2272
Graham, NC 27253
(336) 578-2272
Grades: PK-5
| 368 students
Rank: #2525.
Haw River Elementary School
(Math: 21% | Reading: 24%)
Rank:
Rank:
1/
Bottom 50%10
701 E Main Street
Haw River, NC 27258
(336) 578-0177
Haw River, NC 27258
(336) 578-0177
Grades: PK-5
| 554 students
Rank: #2626.
Graham Middle School
(Math: 19% | Reading: 22%)
Rank:
Rank:
1/
Bottom 50%10
311 E Pine Street
Graham, NC 27253
(336) 570-6460
Graham, NC 27253
(336) 570-6460
Grades: 6-8
| 469 students
Rank: #2727.
Harvey R Newlin Elementary School
(Math: 21% | Reading: 19%)
Rank:
Rank:
1/
Bottom 50%10
316 Carden Street
Burlington, NC 27215
(336) 570-6125
Burlington, NC 27215
(336) 570-6125
Grades: PK-5
| 513 students
Rank: #2828.
Broadview Middle School
(Math: 16% | Reading: 19%)
Rank:
Rank:
1/
Bottom 50%10
2229 Broadview Drive
Burlington, NC 27217
(336) 570-6195
Burlington, NC 27217
(336) 570-6195
Grades: 6-8
| 505 students
Rank: #2929.
Ray Street Academy
Alternative School
(Math: ≤10% | Reading: 11-19%)
Rank:
Rank:
1/
Bottom 50%10
609 Ray Street
Graham, NC 27253
(336) 570-6644
Graham, NC 27253
(336) 570-6644
Grades: 6-12
| 30 students
Recent Articles

Sexual Harassment at Age 6: The Tale of a First Grade Suspension
A six-year old in Aurora, Colorado, was suspended after singing an LMFAO song to a little girl in his class and reportedly “shaking his booty.” We look at the case and the sexual harassment problem in public schools today.

How Scaffolding Could Change the Way Your Child Learns
This article explores the concept of instructional scaffolding, a teaching method that enhances learning by breaking down complex tasks into manageable parts. It highlights how scaffolding supports students in developing critical thinking skills and becoming more independent learners. The article discusses the benefits of scaffolding, including improved engagement and reduced anxiety, and provides strategies for its implementation across various educational levels.

February 05, 2025
Understanding the U.S. Department of Education: Structure, Impact, and EvolutionWe explore how the Department of Education shapes American education, from its cabinet-level leadership to its impact on millions of students, written for general audiences seeking clarity on this vital institution.


