Top Rankings
Cincinnati School District ranks among the top 20% of public school district in Ohio for:
Category
Attribute
Diversity
Most diverse schools (Top 1%)
Community Size
Largest student body (number of students) (Top 1%)
For the 2025 school year, there are 50 public elementary schools serving 23,917 students in Cincinnati School District. This district's average elementary testing ranking is 3/10, which is in the bottom 50% of public elementary schools in Ohio.
Public Elementary Schools in Cincinnati School District have an average math proficiency score of 28% (versus the Ohio public elementary school average of 54%), and reading proficiency score of 39% (versus the 59% statewide average).
Minority enrollment is 80% of the student body (majority Black), which is more than the Ohio public elementary school average of 35% (majority Black).
Overview
This School District
This State (OH)
# Schools
66 Schools
2,458 Schools
# Students
34,858 Students
1,091,015 Students
# Teachers
2,138 Teachers
63,050 Teachers
Student : Teacher Ratio
16:1
16:1
District Rank
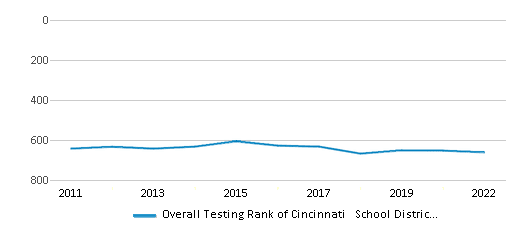
Cincinnati School District, which is ranked within the bottom 50% of all 918 school districts in Ohio (based off of combined math and reading proficiency testing data) for the 2021-2022 school year.
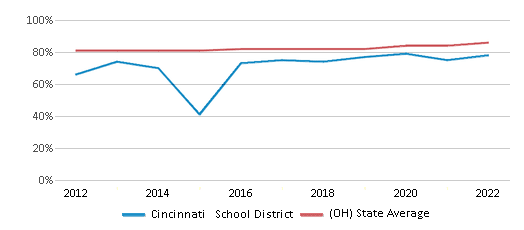
The school district's graduation rate of 78% has increased from 75% over five school years.
Overall District Rank
#661 out of 929 school districts
(Bottom 50%)
(Bottom 50%)
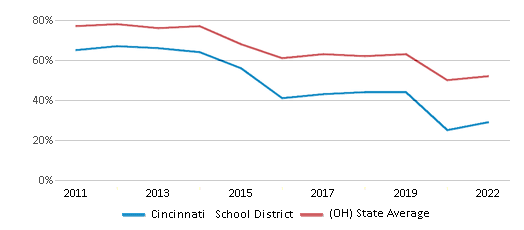
Math Test Scores (% Proficient)
29%
52%
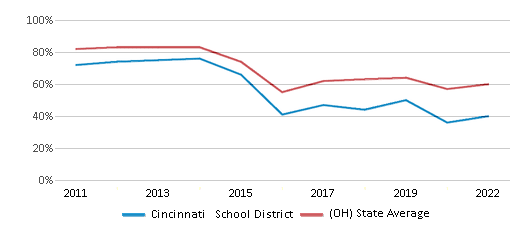
Reading/Language Arts Test Scores (% Proficient)
40%
60%
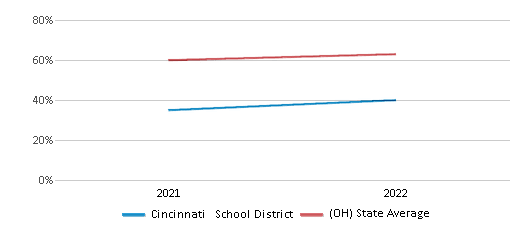
Science Test Scores (% Proficient)
40%
63%
Graduation Rate
78%
86%
Students by Ethnicity:
Diversity Score
0.60
0.55
# American Indian Students
80 Students
1,574 Students
% American Indian Students
n/a
n/a
# Asian Students
422 Students
32,328 Students
% Asian Students
1%
3%
# Hispanic Students
4,234 Students
86,617 Students
% Hispanic Students
12%
8%
# Black Students
20,605 Students
192,244 Students
% Black Students
59%
18%
# White Students
7,156 Students
704,631 Students
% White Students
21%
64%
# Hawaiian Students
36 Students
1,092 Students
% Hawaiian Students
n/a
n/a
# Two or more races Students
2,325 Students
72,529 Students
% of Two or more races Students
7%
7%
Students by Grade:
# Students in PK Grade:
1,876
30,887
# Students in K Grade:
2,680
112,601
# Students in 1st Grade:
2,613
119,240
# Students in 2nd Grade:
2,640
123,668
# Students in 3rd Grade:
2,475
116,979
# Students in 4th Grade:
2,537
120,578
# Students in 5th Grade:
2,546
121,564
# Students in 6th Grade:
2,446
121,429
# Students in 7th Grade:
2,285
90,010
# Students in 8th Grade:
2,437
88,363
# Students in 9th Grade:
3,376
11,363
# Students in 10th Grade:
2,731
10,664
# Students in 11th Grade:
2,273
12,317
# Students in 12th Grade:
1,943
11,352
# Ungraded Students:
-
-
District Revenue and Spending
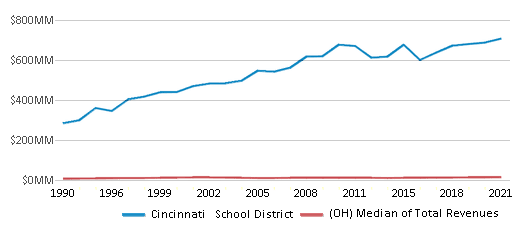
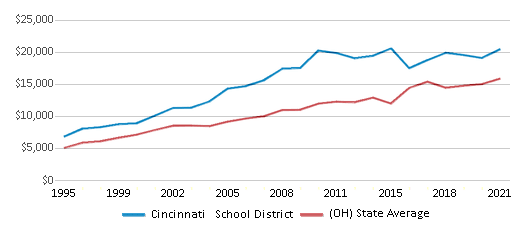
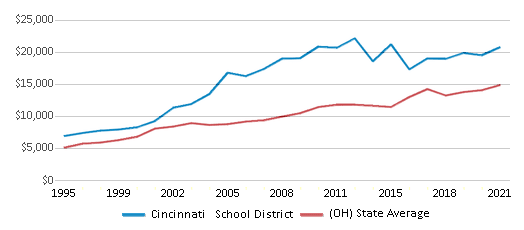
The revenue/student of $20,320 is higher than the state median of $17,287. The school district revenue/student has stayed relatively flat over four school years.
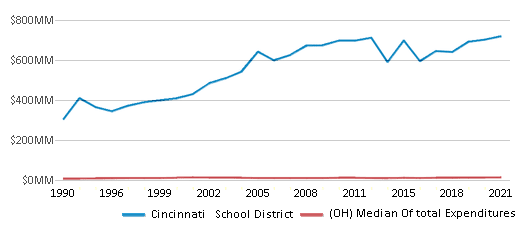
The school district's spending/student of $20,633 is higher than the state median of $17,235. The school district spending/student has stayed relatively flat over four school years.
Total Revenue
$708 MM
$28,879 MM
Spending
$719 MM
$28,792 MM
Revenue / Student
$20,320
$17,287
Spending / Student
$20,633
$17,235
Best Cincinnati School District Public Elementary Schools (2025)
School
(Math and Reading Proficiency)
(Math and Reading Proficiency)
Location
Grades
Students
Rank: #11.
Kilgour School
(Math: 86% | Reading: 88%)
Rank:
Rank:
10/
Top 5%10
1339 Herschel Ave
Cincinnati, OH 45208
(513) 363-3000
Cincinnati, OH 45208
(513) 363-3000
Grades: K-6
| 567 students
Rank: #22.
Spencer Center For Gifted And Exceptional Students
(Math: 84% | Reading: 88%)
Rank:
Rank:
10/
Top 5%10
2825 Alms Pl
Cincinnati, OH 45206
(513) 363-0000
Cincinnati, OH 45206
(513) 363-0000
Grades: 3-12
| 336 students
Rank: #33.
Hyde Park School
(Math: 77% | Reading: 81%)
Rank:
Rank:
9/
Top 20%10
3401 Edwards Rd
Cincinnati, OH 45208
(513) 363-2800
Cincinnati, OH 45208
(513) 363-2800
Grades: K-6
| 574 students
Rank: #44.
Sands Montessori School
(Math: 72% | Reading: 83%)
Rank:
Rank:
9/
Top 20%10
6421 Corbly Rd
Cincinnati, OH 45230
(513) 363-5000
Cincinnati, OH 45230
(513) 363-5000
Grades: PK-6
| 678 students
Rank: #55.
Fairview-clifton German Language School
(Math: 64% | Reading: 72%)
Rank:
Rank:
8/
Top 30%10
3689 Clifton Ave
Cincinnati, OH 45220
(513) 363-2100
Cincinnati, OH 45220
(513) 363-2100
Grades: K-8
| 664 students
Rank: #66.
Clifton Area Neighborhood School
(Math: 50-54% | Reading: 55-59%)
Rank:
Rank:
5/
Bottom 50%10
3711 Clifton Ave
Cincinnati, OH 45220
(513) 363-0000
Cincinnati, OH 45220
(513) 363-0000
Grades: PK-6
| 329 students
Rank: #77.
Dater Montessori School
(Math: 49% | Reading: 56%)
Rank:
Rank:
5/
Bottom 50%10
2840 Boudinot Ave
Cincinnati, OH 45238
(513) 363-0900
Cincinnati, OH 45238
(513) 363-0900
Grades: PK-6
| 754 students
Rank: #88.
Mt. Washington School
(Math: 40-44% | Reading: 50-54%)
Rank:
Rank:
4/
Bottom 50%10
1730 Mears Ave
Cincinnati, OH 45230
(513) 363-3800
Cincinnati, OH 45230
(513) 363-3800
Grades: PK-7
| 286 students
Rank: #99.
School For Creative And Performing Arts
(Math: 31% | Reading: 60%)
Rank:
Rank:
4/
Bottom 50%10
108 W Central Pkwy
Cincinnati, OH 45202
(513) 363-8000
Cincinnati, OH 45202
(513) 363-8000
Grades: K-12
| 1,296 students
Rank: #1010.
Pleasant Ridge Montessori School
(Math: 37% | Reading: 53%)
Rank:
Rank:
4/
Bottom 50%10
5945 Montgomery Rd
Cincinnati, OH 45213
(513) 363-4400
Cincinnati, OH 45213
(513) 363-4400
Grades: PK-6
| 754 students
Rank: #1111.
Covedale School
(Math: 38% | Reading: 46%)
Rank:
Rank:
3/
Bottom 50%10
5130 Sidney Rd
Cincinnati, OH 45238
(513) 363-1700
Cincinnati, OH 45238
(513) 363-1700
Grades: PK-6
| 432 students
Rank: #1212.
John P. Parker School
(Math: 30-34% | Reading: 45-49%)
Rank:
Rank:
3/
Bottom 50%10
5051 Anderson Pl
Cincinnati, OH 45227
(513) 363-2900
Cincinnati, OH 45227
(513) 363-2900
Grades: PK-6
| 362 students
Rank: #1313.
Sayler Park School
(Math: 35-39% | Reading: 40-44%)
Rank:
Rank:
3/
Bottom 50%10
6700 Home City Ave
Cincinnati, OH 45233
(513) 363-5100
Cincinnati, OH 45233
(513) 363-5100
Grades: PK-8
| 322 students
Rank: #1414.
Parker Woods Montessori School
(Math: 31% | Reading: 47%)
Rank:
Rank:
3/
Bottom 50%10
4370 Beech Hill Ave
Cincinnati, OH 45223
(513) 363-6200
Cincinnati, OH 45223
(513) 363-6200
Grades: PK-6
| 623 students
Rank: #1515.
Cheviot School
(Math: 35% | Reading: 43%)
Rank:
Rank:
3/
Bottom 50%10
4040 Harrison Ave
Cincinnati, OH 45211
(513) 363-1400
Cincinnati, OH 45211
(513) 363-1400
Grades: PK-7
| 566 students
Rank: #1616.
North Avondale Montessori School
(Math: 31% | Reading: 46%)
Rank:
Rank:
3/
Bottom 50%10
615 Clinton Springs Ave
Cincinnati, OH 45229
(513) 363-3900
Cincinnati, OH 45229
(513) 363-3900
Grades: PK-6
| 591 students
Rank: #17 - 1817. - 18.
Evanston Academy
(Math: 30-34% | Reading: 40-44%)
Rank:
Rank:
3/
Bottom 50%10
1835 Fairfax Ave
Cincinnati, OH 45207
(513) 363-2700
Cincinnati, OH 45207
(513) 363-2700
Grades: PK-6
| 261 students
Rank: #17 - 1817. - 18.
George Hays-jennie Porter School
(Math: 30-34% | Reading: 40-44%)
Rank:
Rank:
3/
Bottom 50%10
1030 Cutter St
Cincinnati, OH 45203
(513) 363-1000
Cincinnati, OH 45203
(513) 363-1000
Grades: PK-6
| 280 students
Rank: #1919.
Westwood School
(Math: 30% | Reading: 37%)
Rank:
Rank:
3/
Bottom 50%10
2981 Montana Ave
Cincinnati, OH 45211
(513) 363-5900
Cincinnati, OH 45211
(513) 363-5900
Grades: K-8
| 379 students
Rank: #2020.
Silverton Elementary School
(Math: 20-24% | Reading: 35-39%)
Rank:
Rank:
2/
Bottom 50%10
7451 Montgomery Rd
Cincinnati, OH 45236
(513) 363-5400
Cincinnati, OH 45236
(513) 363-5400
Grades: PK-6
| 302 students
Rank: #2121.
Mt. Airy School
(Math: 28% | Reading: 30%)
Rank:
Rank:
2/
Bottom 50%10
5730 Colerain Ave
Cincinnati, OH 45239
(513) 363-3700
Cincinnati, OH 45239
(513) 363-3700
Grades: PK-6
| 561 students
Rank: #2222.
Hartwell School
(Math: 25% | Reading: 33%)
Rank:
Rank:
2/
Bottom 50%10
8320 Vine St
Cincinnati, OH 45216
(513) 363-2300
Cincinnati, OH 45216
(513) 363-2300
Grades: 2-8
| 466 students
Rank: #2323.
College Hill Fundamental Academy
(Math: 20-24% | Reading: 30-34%)
Rank:
Rank:
2/
Bottom 50%10
1625 Cedar Ave
Cincinnati, OH 45224
(513) 363-1600
Cincinnati, OH 45224
(513) 363-1600
Grades: PK-6
| 433 students
Rank: #2424.
Winton Hills Academy
(Math: 15-19% | Reading: 35-39%)
Rank:
Rank:
2/
Bottom 50%10
5300 Winneste Ave
Cincinnati, OH 45232
(513) 363-6300
Cincinnati, OH 45232
(513) 363-6300
Grades: PK-6
| 306 students
Rank: #2525.
Chase School
(Math: 20-24% | Reading: 25-29%)
Rank:
Rank:
2/
Bottom 50%10
4151 Turrill St
Cincinnati, OH 45223
(513) 363-1300
Cincinnati, OH 45223
(513) 363-1300
Grades: PK-6
| 293 students
Rank: #2626.
Midway School
(Math: 21% | Reading: 28%)
Rank:
Rank:
2/
Bottom 50%10
3156 Glenmore Ave
Cincinnati, OH 45211
(513) 363-3500
Cincinnati, OH 45211
(513) 363-3500
Grades: PK-6
| 531 students
Rank: #2727.
James N. Gamble Montessori Elementary School
(Math: 10-14% | Reading: 35-39%)
Rank:
Rank:
2/
Bottom 50%10
2700 Felicity Pl
Cincinnati, OH 45211
(513) 363-2600
Cincinnati, OH 45211
(513) 363-2600
Grades: PK-6
| 478 students
Rank: #2828.
Rees E. Price Academy
(Math: 22% | Reading: 25%)
Rank:
Rank:
2/
Bottom 50%10
1228 Considine Ave
Cincinnati, OH 45204
(513) 363-0000
Cincinnati, OH 45204
(513) 363-0000
Grades: PK-7
| 470 students
Rank: #2929.
Woodford Academy
(Math: 15-19% | Reading: 25-29%)
Rank:
Rank:
2/
Bottom 50%10
3716 Woodford Rd
Cincinnati, OH 45213
(513) 363-6400
Cincinnati, OH 45213
(513) 363-6400
Grades: PK-6
| 334 students
Rank: #3030.
Carson School
(Math: 20% | Reading: 23%)
Rank:
Rank:
2/
Bottom 50%10
4323 Glenway Ave
Cincinnati, OH 45205
(513) 363-9800
Cincinnati, OH 45205
(513) 363-9800
Grades: PK-7
| 735 students
Rank: #3131.
Academy Of World Languages School
(Math: 15% | Reading: 28%)
Rank:
Rank:
2/
Bottom 50%10
2030 Fairfax Ave
Cincinnati, OH 45207
(513) 363-7800
Cincinnati, OH 45207
(513) 363-7800
Grades: PK-8
| 548 students
Rank: #3232.
Roselawn Condon School
(Math: 14% | Reading: 27%)
Rank:
Rank:
2/
Bottom 50%10
1594 Summit Rd
Cincinnati, OH 45237
(513) 363-4800
Cincinnati, OH 45237
(513) 363-4800
Grades: PK-8
| 399 students
Rank: #3333.
Rockdale Academy
(Math: 10-14% | Reading: 25-29%)
Rank:
Rank:
2/
Bottom 50%10
335 Rockdale Ave
Cincinnati, OH 45229
(513) 363-4700
Cincinnati, OH 45229
(513) 363-4700
Grades: PK-6
| 262 students
Rank: #3434.
Bond Hill Academy
(Math: 15-19% | Reading: 15-19%)
Rank:
Rank:
2/
Bottom 50%10
1510 California Ave
Cincinnati, OH 45237
(513) 363-7900
Cincinnati, OH 45237
(513) 363-7900
Grades: PK-6
| 297 students
Rank: #35 - 3635. - 36.
Academy For Multilingual Immersion Studies
(Math: 13% | Reading: 23%)
Rank:
Rank:
1/
Bottom 50%10
1908 Seymour Ave
Cincinnati, OH 45237
(513) 363-1800
Cincinnati, OH 45237
(513) 363-1800
Grades: PK-8
| 561 students
Show 15 more public schools in Cincinnati School District (out of 50 total schools)
Loading...
Recent Articles

Year-Round Or Traditional Schedule?
Which is more appropriate for your child? A year-round attendance schedule or traditional schedule? We look at the pros and cons.

Why You Should Encourage Your Child to Join a Sports Team
Participating in team sports has a great many benefits for children, there is no doubt. In this article you will learn what those benefits are.

White Students are Now the Minority in U.S. Public Schools
Increasing birth rates among immigrant families from Asia and Central and South America, combined with lower birth rates among white families, means that for the first time in history, public school students in the United States are majority-minority. This shift in demographics poses difficulties for schools as they work to accommodate children of varying language abilities and socio-economic backgrounds.


