Top Rankings
Butler Area School District ranks among the top 20% of public school district in Pennsylvania for:
Category
Attribute
Community Size
Largest student body (number of students) (Top 1%)
For the 2025 school year, there are 8 public elementary schools serving 3,839 students in Butler Area School District. This district's average elementary testing ranking is 7/10, which is in the top 50% of public elementary schools in Pennsylvania.
Public Elementary Schools in Butler Area School District have an average math proficiency score of 38% (versus the Pennsylvania public elementary school average of 35%), and reading proficiency score of 60% (versus the 54% statewide average).
Minority enrollment is 8% of the student body (majority Hispanic and Black), which is less than the Pennsylvania public elementary school average of 42% (majority Hispanic and Black).
Overview
This School District
This State (PA)
# Schools
9 Schools
2,145 Schools
# Students
5,807 Students
1,108,977 Students
# Teachers
428 Teachers
82,943 Teachers
Student : Teacher Ratio
14:1
14:1
District Rank
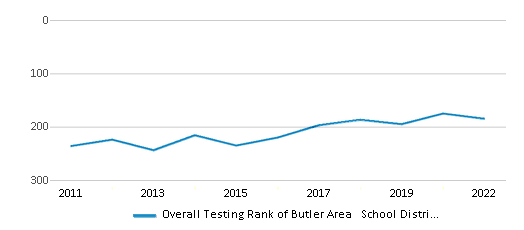
Butler Area School District, which is ranked within the top 50% of all 675 school districts in Pennsylvania (based off of combined math and reading proficiency testing data) for the 2021-2022 school year.
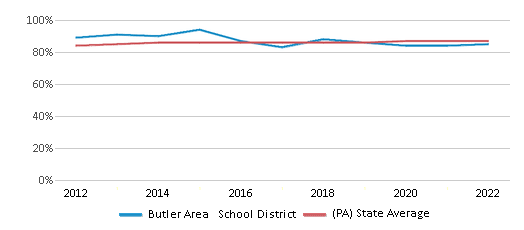
The school district's graduation rate of 85% has increased from 83% over five school years.
Overall District Rank
#185 out of 684 school districts
(Top 30%)
(Top 30%)
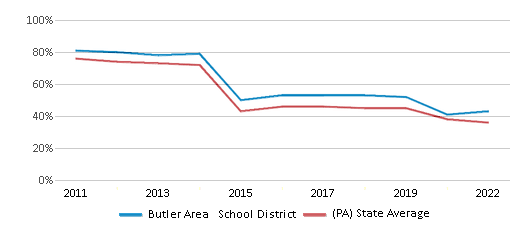
Math Test Scores (% Proficient)
43%
36%
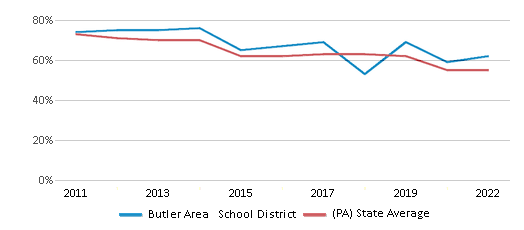
Reading/Language Arts Test Scores (% Proficient)
62%
55%
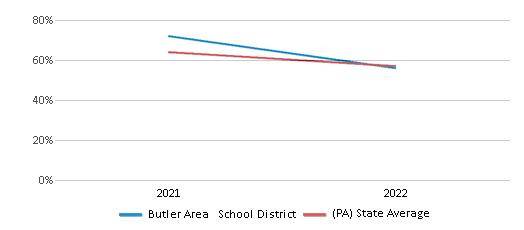
Science Test Scores (% Proficient)
56%
57%
Graduation Rate
85%
87%
Students by Ethnicity:
Diversity Score
0.16
0.61
# American Indian Students
15 Students
2,278 Students
% American Indian Students
n/a
n/a
# Asian Students
19 Students
51,838 Students
% Asian Students
n/a
5%
# Hispanic Students
134 Students
173,776 Students
% Hispanic Students
2%
16%
# Black Students
112 Students
169,696 Students
% Black Students
2%
15%
# White Students
5,322 Students
645,871 Students
% White Students
92%
58%
# Hawaiian Students
4 Students
965 Students
% Hawaiian Students
n/a
n/a
# Two or more races Students
201 Students
63,991 Students
% of Two or more races Students
4%
6%
Students by Grade:
# Students in PK Grade:
-
7,744
# Students in K Grade:
397
110,287
# Students in 1st Grade:
470
120,767
# Students in 2nd Grade:
412
126,133
# Students in 3rd Grade:
412
120,907
# Students in 4th Grade:
446
125,574
# Students in 5th Grade:
438
126,000
# Students in 6th Grade:
422
126,698
# Students in 7th Grade:
402
94,854
# Students in 8th Grade:
440
93,972
# Students in 9th Grade:
516
16,255
# Students in 10th Grade:
505
14,467
# Students in 11th Grade:
504
12,872
# Students in 12th Grade:
443
12,447
# Ungraded Students:
-
-
District Revenue and Spending
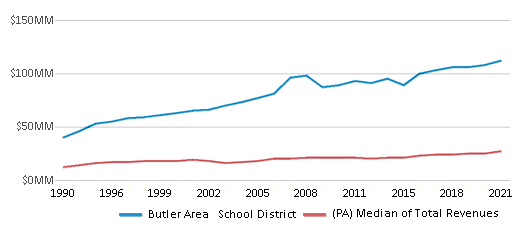
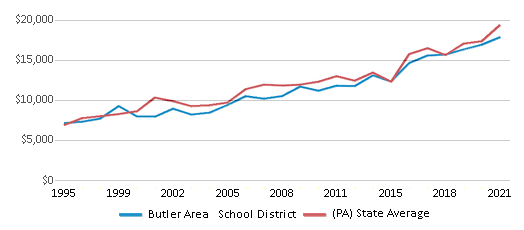
The revenue/student of $19,221 in this school district is less than the state median of $23,696. The school district revenue/student has stayed relatively flat over four school years.
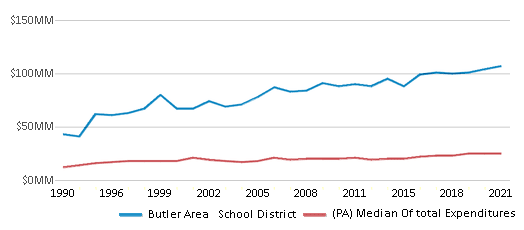
The school district's spending/student of $18,427 is less than the state median of $23,119. The school district spending/student has stayed relatively flat over four school years.
Total Revenue
$112 MM
$39,541 MM
Spending
$107 MM
$38,578 MM
Revenue / Student
$19,221
$23,696
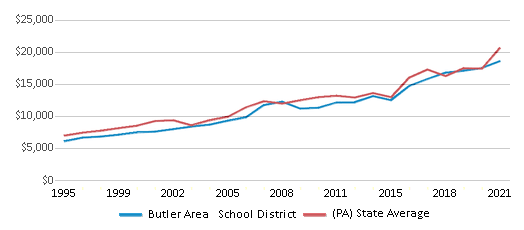
Spending / Student
$18,427
$23,119
Best Butler Area School District Public Elementary Schools (2025)
School
(Math and Reading Proficiency)
(Math and Reading Proficiency)
Location
Grades
Students
Rank: #11.
Connoquenessing Elementary School
(Math: 60-64% | Reading: 70-74%)
Rank:
Rank:
9/
Top 20%10
102 Connoquenessing School Roa
Renfrew, PA 16053
(724) 287-8721
Renfrew, PA 16053
(724) 287-8721
Grades: K-5
| 296 students
Rank: #2 - 32. - 3.
Mcquistion Elementary School
(Math: 60-64% | Reading: 65-69%)
Rank:
Rank:
8/
Top 30%10
210 Mechling Drive
Butler, PA 16001
(724) 287-8721
Butler, PA 16001
(724) 287-8721
Grades: K-5
| 522 students
Rank: #2 - 32. - 3.
Northwest Elementary School
(Math: 60-64% | Reading: 65-69%)
Rank:
Rank:
8/
Top 30%10
124 Staley Avenue
Butler, PA 16001
(724) 287-8721
Butler, PA 16001
(724) 287-8721
Grades: K-5
| 425 students
Rank: #44.
Center Township Elementary School
(Math: 58% | Reading: 68%)
Rank:
Rank:
8/
Top 30%10
950 Mercer Road
Butler, PA 16001
(724) 287-8721
Butler, PA 16001
(724) 287-8721
Grades: K-5
| 608 students
Rank: #55.
Summit Township Elementary School
(Math: 45-49% | Reading: 50-54%)
Rank:
Rank:
6/
Top 50%10
351 Brinker Road
Butler, PA 16002
(724) 287-8721
Butler, PA 16002
(724) 287-8721
Grades: K-5
| 246 students
Rank: #66.
Butler Area Ihs
(Math: 22% | Reading: 59%)
Rank:
Rank:
4/
Bottom 50%10
551 Fairground Hill Road
Butler, PA 16001
(724) 287-8721
Butler, PA 16001
(724) 287-8721
Grades: 6-8
| 1,267 students
Rank: #77.
Emily Brittain Elementary School
(Math: 40-44% | Reading: 40-44%)
Rank:
Rank:
4/
Bottom 50%10
338 North Washington Street
Butler, PA 16001
(724) 287-8721
Butler, PA 16001
(724) 287-8721
Grades: K-5
| 249 students
Rank: #88.
Broad Street Elementary School
(Math: 20-24% | Reading: 40-44%)
Rank:
Rank:
3/
Bottom 50%10
200 Broad St
Butler, PA 16001
(724) 214-3630
Butler, PA 16001
(724) 214-3630
Grades: K-5
| 226 students
Recent Articles

Year-Round Or Traditional Schedule?
Which is more appropriate for your child? A year-round attendance schedule or traditional schedule? We look at the pros and cons.

Why You Should Encourage Your Child to Join a Sports Team
Participating in team sports has a great many benefits for children, there is no doubt. In this article you will learn what those benefits are.

White Students are Now the Minority in U.S. Public Schools
Increasing birth rates among immigrant families from Asia and Central and South America, combined with lower birth rates among white families, means that for the first time in history, public school students in the United States are majority-minority. This shift in demographics poses difficulties for schools as they work to accommodate children of varying language abilities and socio-economic backgrounds.


