Top Rankings
Providence School District ranks among the top 20% of public school district in Rhode Island for:
Category
Attribute
Community Size
Largest student body (number of students) (Top 1%)
For the 2025 school year, there are 29 public elementary schools serving 13,456 students in Providence School District. This district's average elementary testing ranking is 1/10, which is in the bottom 50% of public elementary schools in Rhode Island.
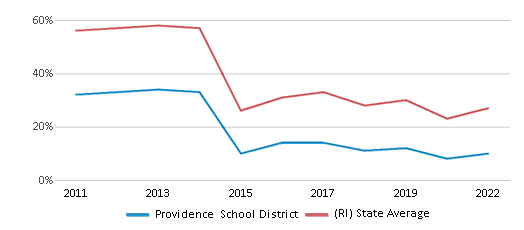
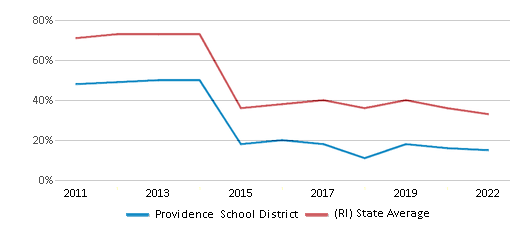
Public Elementary Schools in Providence School District have an average math proficiency score of 10% (versus the Rhode Island public elementary school average of 27%), and reading proficiency score of 13% (versus the 31% statewide average).
Minority enrollment is 92% of the student body (majority Hispanic), which is more than the Rhode Island public elementary school average of 49% (majority Hispanic).
Overview
This School District
This State (RI)
# Schools
40 Schools
232 Schools
# Students
20,102 Students
89,628 Students
# Teachers
1,430 Teachers
6,950 Teachers
Student : Teacher Ratio
14:1
14:1
District Rank
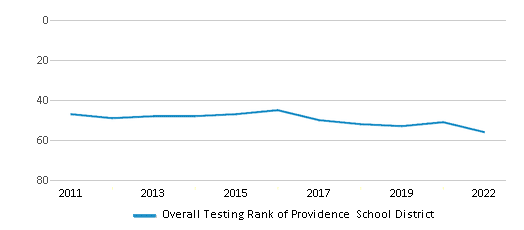
Providence School District, which is ranked within the bottom 50% of all 62 school districts in Rhode Island (based off of combined math and reading proficiency testing data) for the 2021-2022 school year.
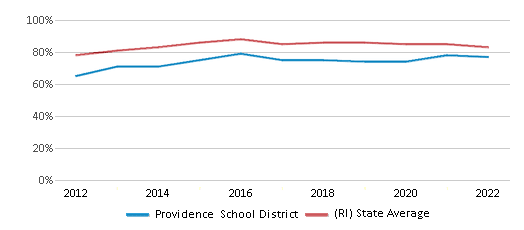
The school district's graduation rate of 77% has increased from 75% over five school years.
Overall District Rank
#56 out of 63 school districts
(Bottom 50%)
(Bottom 50%)
Math Test Scores (% Proficient)
10%
27%
Reading/Language Arts Test Scores (% Proficient)
15%
33%
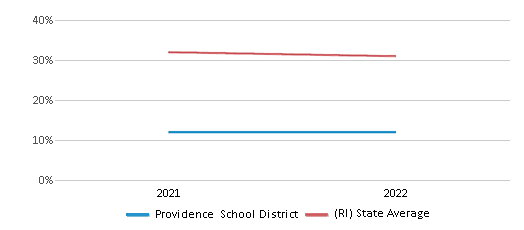
Science Test Scores (% Proficient)
12%
31%
Graduation Rate
77%
83%
Students by Ethnicity:
Diversity Score
0.55
0.65
# American Indian Students
151 Students
659 Students
% American Indian Students
1%
1%
# Asian Students
712 Students
2,928 Students
% Asian Students
4%
3%
# Hispanic Students
13,074 Students
26,752 Students
% Hispanic Students
66%
30%
# Black Students
2,813 Students
7,772 Students
% Black Students
15%
9%
# White Students
1,510 Students
45,537 Students
% White Students
8%
51%
# Hawaiian Students
37 Students
145 Students
% Hawaiian Students
1%
n/a
# Two or more races Students
765 Students
4,855 Students
% of Two or more races Students
5%
6%
Students by Grade:
# Students in PK Grade:
541
2,236
# Students in K Grade:
1,328
9,071
# Students in 1st Grade:
1,386
9,614
# Students in 2nd Grade:
1,398
9,986
# Students in 3rd Grade:
1,338
9,591
# Students in 4th Grade:
1,553
9,843
# Students in 5th Grade:
1,501
9,898
# Students in 6th Grade:
1,379
9,834
# Students in 7th Grade:
1,391
9,606
# Students in 8th Grade:
1,468
9,663
# Students in 9th Grade:
1,573
73
# Students in 10th Grade:
1,886
87
# Students in 11th Grade:
1,738
76
# Students in 12th Grade:
1,622
50
# Ungraded Students:
-
-
District Revenue and Spending
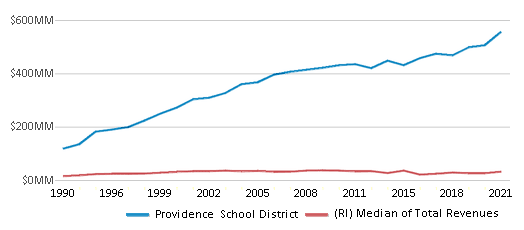
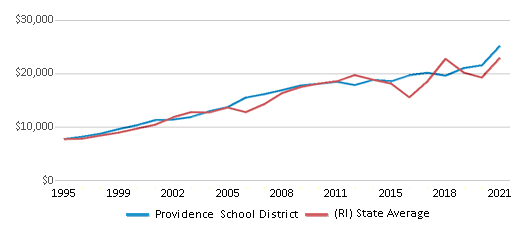
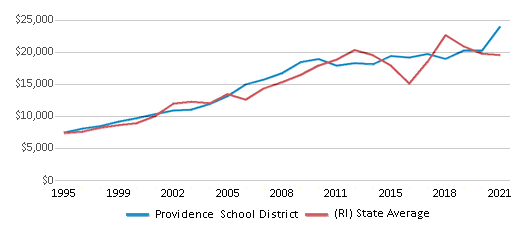
The revenue/student of $27,655 is higher than the state median of $22,250. The school district revenue/student has grown by 10% over four school years.
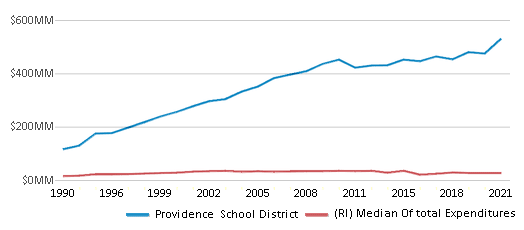
The school district's spending/student of $26,390 is higher than the state median of $21,467. The school district spending/student has grown by 10% over four school years.
Total Revenue
$556 MM
$2,998 MM
Spending
$531 MM
$2,892 MM
Revenue / Student
$27,655
$22,250
Spending / Student
$26,390
$21,467
Best Providence School District Public Elementary Schools (2025)
School
(Math and Reading Proficiency)
(Math and Reading Proficiency)
Location
Grades
Students
Rank: #11.
Vartan Gregorian El. School
(Math: 40-44% | Reading: 40-44%)
Rank:
Rank:
8/
Top 30%10
455 Wickenden Street
Providence, RI 02903
(401) 456-9377
Providence, RI 02903
(401) 456-9377
Grades: PK-5
| 311 students
Rank: #22.
Robert F. Kennedy El. School
(Math: 27% | Reading: 24%)
Rank:
Rank:
5/
Bottom 50%10
195 Nelson Street
Providence, RI 02908
(401) 456-9403
Providence, RI 02908
(401) 456-9403
Grades: K-5
| 422 students
Rank: #33.
Martin Luther King El. School
(Math: 15-19% | Reading: 25-29%)
Rank:
Rank:
4/
Bottom 50%10
35 Camp Street
Providence, RI 02906
(401) 456-9398
Providence, RI 02906
(401) 456-9398
Grades: PK-5
| 399 students
Rank: #44.
Times2 Elementary School
Charter School
(Math: 15-19% | Reading: 20-24%)
Rank:
Rank:
4/
Bottom 50%10
50 Fillmore Street
Providence, RI 02908
(401) 272-5094
Providence, RI 02908
(401) 272-5094
Grades: K-5
| 313 students
Rank: #55.
Anthony Carnevale Elementary School
(Math: 17% | Reading: 18%)
Rank:
Rank:
4/
Bottom 50%10
50 Springfield Street
Providence, RI 02909
(401) 278-0554
Providence, RI 02909
(401) 278-0554
Grades: PK-5
| 477 students
Rank: #6 - 76. - 7.
Pleasant View School
(Math: 15-19% | Reading: 15-19%)
Rank:
Rank:
3/
Bottom 50%10
110 Paul Street
Providence, RI 02904
(401) 456-9325
Providence, RI 02904
(401) 456-9325
Grades: PK-5
| 419 students
Rank: #6 - 76. - 7.
William D'abate Elem. School
(Math: 15-19% | Reading: 15-19%)
Rank:
Rank:
3/
Bottom 50%10
60 Kossuth Street
Providence, RI 02909
(401) 456-9416
Providence, RI 02909
(401) 456-9416
Grades: PK-5
| 401 students
Rank: #88.
Reservoir Avenue School
(Math: 20-24% | Reading: 10-14%)
Rank:
Rank:
3/
Bottom 50%10
156 Reservoir Avenue
Providence, RI 02907
(401) 456-9406
Providence, RI 02907
(401) 456-9406
Grades: K-5
| 292 students
Rank: #99.
Nathan Bishop Middle School
(Math: 14% | Reading: 22%)
Rank:
Rank:
3/
Bottom 50%10
101 Sessions Street
Providence, RI 02906
(401) 456-9344
Providence, RI 02906
(401) 456-9344
Grades: 6-8
| 669 students
Rank: #1010.
Nathanael Greene Middle School
(Math: 15% | Reading: 19%)
Rank:
Rank:
3/
Bottom 50%10
721 Chalkstone Avenue
Providence, RI 02908
(401) 456-9347
Providence, RI 02908
(401) 456-9347
Grades: 6-8
| 803 students
Rank: #1111.
Leviton Dual Language School
(Math: 15-19% | Reading: 10-14%)
Rank:
Rank:
3/
Bottom 50%10
65 Greenwich Street
Providence, RI 02907
(401) 278-2872
Providence, RI 02907
(401) 278-2872
Grades: K-5
| 300 students
Rank: #12 - 1312. - 13.
Robert L. Bailey Iv
(Math: 12% | Reading: 18%)
Rank:
Rank:
3/
Bottom 50%10
65 Gordon Avenue
Providence, RI 02905
(401) 456-1735
Providence, RI 02905
(401) 456-1735
Grades: K-5
| 440 students
Rank: #12 - 1312. - 13.
Times2 Middle/high School
Charter School
(Math: 12% | Reading: 18%)
Rank:
Rank:
3/
Bottom 50%10
50 Fillmore Street
Providence, RI 02908
(401) 272-5094
Providence, RI 02908
(401) 272-5094
Grades: 6-12
| 374 students
Rank: #1414.
Frank D. Spaziano Elementary School
(Math: 14% | Reading: 15%)
Rank:
Rank:
2/
Bottom 50%10
85 Laurel Hill Avenue
Providence, RI 02909
(401) 456-9389
Providence, RI 02909
(401) 456-9389
Grades: PK-5
| 500 students
Rank: #1515.
Lillian Feinstein El. School
(Math: 12% | Reading: 15%)
Rank:
Rank:
2/
Bottom 50%10
159 Sackett Street
Providence, RI 02907
(401) 456-9407
Providence, RI 02907
(401) 456-9407
Grades: K-5
| 432 students
Rank: #1616.
Veazie Street School
(Math: 15% | Reading: 11%)
Rank:
Rank:
2/
Bottom 50%10
211 Veazie Street
Providence, RI 02904
(401) 453-8601
Providence, RI 02904
(401) 453-8601
Grades: PK-5
| 459 students
Rank: #1717.
Asa Messer El. School
(Math: 10-14% | Reading: 6-9%)
Rank:
Rank:
2/
Bottom 50%10
1655 Westminster Street
Providence, RI 02909
(401) 456-9401
Providence, RI 02909
(401) 456-9401
Grades: PK-4
| 538 students
Rank: #1818.
Cornel Young & Charlotte Woods
(Math: 9% | Reading: 13%)
Rank:
Rank:
2/
Bottom 50%10
674 Prairie Avenue
Providence, RI 02905
(401) 278-0515
Providence, RI 02905
(401) 278-0515
Grades: PK-5
| 607 students
Rank: #1919.
Webster Avenue School
(Math: 6-9% | Reading: 10-14%)
Rank:
Rank:
2/
Bottom 50%10
191 Webster Avenue
Providence, RI 02909
(401) 456-9414
Providence, RI 02909
(401) 456-9414
Grades: K-5
| 311 students
Rank: #2020.
George J. West El. School
(Math: 7% | Reading: 14%)
Rank:
Rank:
1/
Bottom 50%10
145 Beaufort Street
Providence, RI 02908
(401) 456-9337
Providence, RI 02908
(401) 456-9337
Grades: K-5
| 533 students
Rank: #2121.
Harry Kizirian Elementary School
(Math: 8% | Reading: 10%)
Rank:
Rank:
1/
Bottom 50%10
60 Camden Avenue
Providence, RI 02908
(401) 456-9369
Providence, RI 02908
(401) 456-9369
Grades: PK-5
| 500 students
Rank: #2222.
West Broadway Middle School
(Math: 4% | Reading: 11%)
Rank:
Rank:
1/
Bottom 50%10
29 Bainbridge Avenue
Providence, RI 02909
(401) 456-9102
Providence, RI 02909
(401) 456-9102
Grades: 5-8
| 499 students
Rank: #2323.
Alfred Lima Sr. El School
(Math: 7% | Reading: 5%)
Rank:
Rank:
1/
Bottom 50%10
222 Daboll Street
Providence, RI 02907
(401) 278-0504
Providence, RI 02907
(401) 278-0504
Grades: K-5
| 645 students
Rank: #2424.
Gilbert Stuart Middle School
(Math: 3% | Reading: 9%)
Rank:
Rank:
1/
Bottom 50%10
188 Princeton Avenue
Providence, RI 02907
(401) 456-9340
Providence, RI 02907
(401) 456-9340
Grades: 6-8
| 469 students
Rank: #2525.
Mary E. Fogarty El. School
(Math: 6% | Reading: 4%)
Rank:
Rank:
1/
Bottom 50%10
199 Oxford Street
Providence, RI 02905
(401) 456-9381
Providence, RI 02905
(401) 456-9381
Grades: K-5
| 403 students
Rank: #2626.
Governor Christopher Delsesto
(Math: 2% | Reading: 7%)
Rank:
Rank:
1/
Bottom 50%10
152 Springfield Street
Providence, RI 02909
(401) 278-0557
Providence, RI 02909
(401) 278-0557
Grades: 6-8
| 647 students
Rank: #2727.
Roger Williams Middle School
(Math: ≤1% | Reading: 6%)
Rank:
Rank:
1/
Bottom 50%10
278 Thurbers Avenue
Providence, RI 02905
(401) 456-9355
Providence, RI 02905
(401) 456-9355
Grades: 6-8
| 651 students
Rank: #2828.
Esek Hopkins Middle School
(Math: 3% | Reading: 4%)
Rank:
Rank:
1/
Bottom 50%10
480 Charles Street
Providence, RI 02904
(401) 456-9203
Providence, RI 02904
(401) 456-9203
Grades: 6-8
| 393 students
Rank: n/an/a
234 Daboll Street
Providence, RI 02907
(401) 278-0501
Providence, RI 02907
(401) 278-0501
Grades: PK-1
| 249 students
Recent Articles

What Is A Charter School?
Explore the world of charter schools in this comprehensive guide. Learn about their history, how they operate, and the pros and cons of this educational innovation. Discover key facts about charter schools, including admission policies, demographics, and funding, as well as what to look for when considering a charter school for your child.

10 Reasons Why High School Sports Benefit Students
Discover the 10 compelling reasons why high school sports are beneficial for students. This comprehensive article explores how athletics enhance academic performance, foster personal growth, and develop crucial life skills. From improved fitness and time management to leadership development and community representation, learn why participating in high school sports can be a game-changer for students' overall success and well-being.

February 05, 2025
Understanding the U.S. Department of Education: Structure, Impact, and EvolutionWe explore how the Department of Education shapes American education, from its cabinet-level leadership to its impact on millions of students, written for general audiences seeking clarity on this vital institution.


