Top Rankings
Lexington 01 School District ranks among the top 20% of public school district in South Carolina for:
Category
Attribute
Overall Rank
Highest overall rank (Top 20%)
Reading/Language Arts Proficiency
Highest reading/language arts proficiency (Top 20%)
Community Size
Largest student body (number of students) (Top 1%)
Student Attention
Lowest student:teacher ratio (Top 1%)
For the 2025 school year, there are 25 public elementary schools serving 18,595 students in Lexington 01 School District. This district's average elementary testing ranking is 8/10, which is in the top 30% of public elementary schools in South Carolina.
Public Elementary Schools in Lexington 01 School District have an average math proficiency score of 44% (versus the South Carolina public elementary school average of 39%), and reading proficiency score of 52% (versus the 47% statewide average).
Minority enrollment is 35% of the student body (majority Black and Hispanic), which is less than the South Carolina public elementary school average of 53% (majority Black).
Overview
This School District
This State (SC)
# Schools
31 Schools
965 Schools
# Students
27,105 Students
551,243 Students
# Teachers
2,092 Teachers
39,892 Teachers
Student : Teacher Ratio
13:1
13:1
District Rank
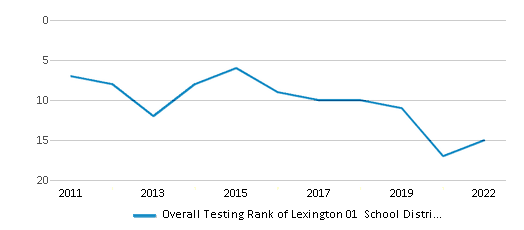
Lexington 01 School District, which is ranked within the top 20% of all 76 school districts in South Carolina (based off of combined math and reading proficiency testing data) for the 2021-2022 school year.
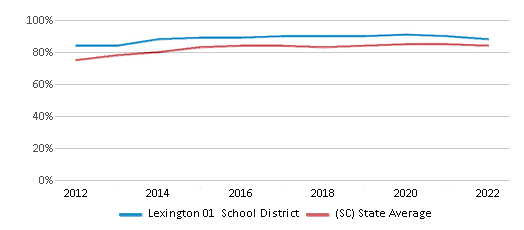
The school district's graduation rate of 88% has decreased from 90% over five school years.
Overall District Rank
#15 out of 81 school districts
(Top 20%)
(Top 20%)
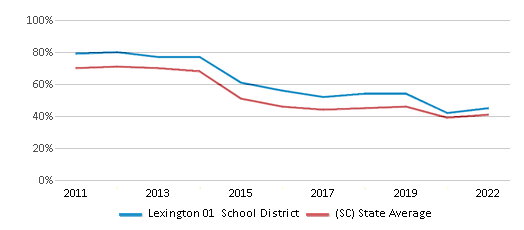
Math Test Scores (% Proficient)
45%
41%
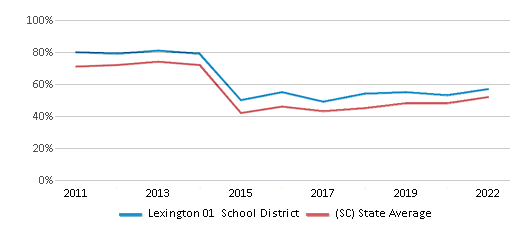
Reading/Language Arts Test Scores (% Proficient)
57%
52%
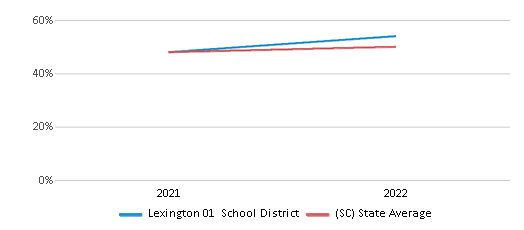
Science Test Scores (% Proficient)
54%
50%
Graduation Rate
88%
84%
Students by Ethnicity:
Diversity Score
0.54
0.67
# American Indian Students
53 Students
1,609 Students
% American Indian Students
n/a
n/a
# Asian Students
972 Students
10,166 Students
% Asian Students
4%
2%
# Hispanic Students
3,150 Students
74,117 Students
% Hispanic Students
12%
13%
# Black Students
3,679 Students
170,518 Students
% Black Students
13%
31%
# White Students
17,689 Students
258,372 Students
% White Students
65%
47%
# Hawaiian Students
38 Students
663 Students
% Hawaiian Students
n/a
n/a
# Two or more races Students
1,524 Students
35,675 Students
% of Two or more races Students
6%
7%
Students by Grade:
# Students in PK Grade:
680
24,436
# Students in K Grade:
1,744
53,057
# Students in 1st Grade:
1,872
56,847
# Students in 2nd Grade:
2,052
58,232
# Students in 3rd Grade:
1,893
57,411
# Students in 4th Grade:
1,979
57,861
# Students in 5th Grade:
2,138
58,020
# Students in 6th Grade:
2,075
58,906
# Students in 7th Grade:
2,009
54,750
# Students in 8th Grade:
2,153
55,491
# Students in 9th Grade:
2,409
4,594
# Students in 10th Grade:
2,221
4,219
# Students in 11th Grade:
1,826
3,860
# Students in 12th Grade:
2,054
3,559
# Ungraded Students:
-
-
District Revenue and Spending
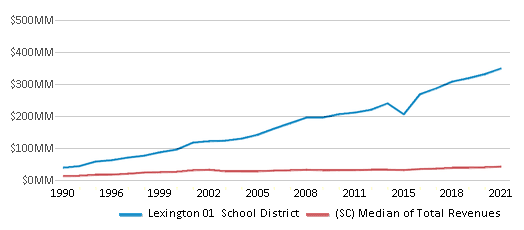
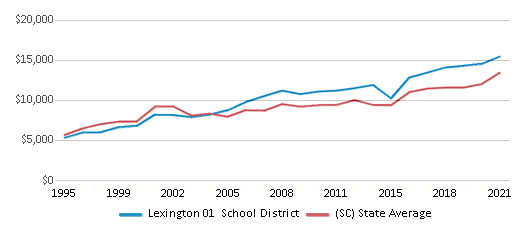
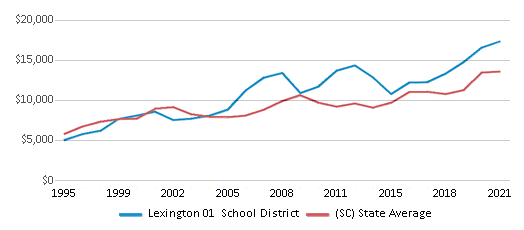
The revenue/student of $15,450 is higher than the state median of $15,220. The school district revenue/student has stayed relatively flat over four school years.
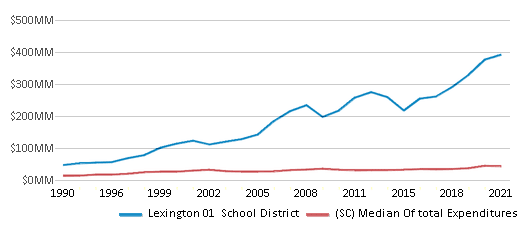
The school district's spending/student of $17,325 is higher than the state median of $14,817. The school district spending/student has stayed relatively flat over four school years.
Total Revenue
$419 MM
$12,084 MM
Spending
$470 MM
$11,764 MM
Revenue / Student
$15,450
$15,220
Spending / Student
$17,325
$14,817
Best Lexington 01 School District Public Elementary Schools (2025)
School
(Math and Reading Proficiency)
(Math and Reading Proficiency)
Location
Grades
Students
Rank: #11.
Lake Murray Elementary School
(Math: 78% | Reading: 76%)
Rank:
Rank:
10/
Top 10%10
205 Wise Ferry Road
Lexington, SC 29072
(803) 821-3100
Lexington, SC 29072
(803) 821-3100
Grades: PK-5
| 867 students
Rank: #22.
New Providence Elementary School
(Math: 72% | Reading: 75%)
Rank:
Rank:
9/
Top 20%10
1118 Old Cherokee Road
Lexington, SC 29072
(803) 821-3300
Lexington, SC 29072
(803) 821-3300
Grades: K-5
| 797 students
Rank: #33.
Meadow Glen Elementary School
(Math: 74% | Reading: 72%)
Rank:
Rank:
9/
Top 20%10
510 Ginny Lane
Lexington, SC 29072
(803) 821-0400
Lexington, SC 29072
(803) 821-0400
Grades: PK-5
| 790 students
Rank: #44.
Midway Elementary School
(Math: 69% | Reading: 70%)
Rank:
Rank:
9/
Top 20%10
180 Midway Road
Lexington, SC 29072
(803) 821-0300
Lexington, SC 29072
(803) 821-0300
Grades: PK-5
| 864 students
Rank: #55.
Pleasant Hill Elementary School
(Math: 62% | Reading: 67%)
Rank:
Rank:
9/
Top 20%10
664 Rawl Road
Lexington, SC 29072
(803) 821-2800
Lexington, SC 29072
(803) 821-2800
Grades: PK-5
| 874 students
Rank: #66.
Rocky Creek Elementary School
(Math: 61% | Reading: 65%)
Rank:
Rank:
8/
Top 30%10
430 Calks Ferry Road
Lexington, SC 29072
(803) 821-4200
Lexington, SC 29072
(803) 821-4200
Grades: PK-5
| 806 students
Rank: #77.
Meadow Glen Middle School
(Math: 52% | Reading: 64%)
Rank:
Rank:
8/
Top 30%10
440 Ginny Lane
Lexington, SC 29072
(803) 821-0600
Lexington, SC 29072
(803) 821-0600
Grades: 6-8
| 733 students
Rank: #88.
Deerfield Elementary School
(Math: 54% | Reading: 57%)
Rank:
Rank:
7/
Top 50%10
638 Longs Pond Road
Lexington, SC 29073
(803) 821-5500
Lexington, SC 29073
(803) 821-5500
Grades: PK-5
| 771 students
Rank: #99.
Beechwood Middle School
(Math: 47% | Reading: 60%)
Rank:
Rank:
7/
Top 50%10
1340 Highway 378
Lexington, SC 29072
(803) 821-5700
Lexington, SC 29072
(803) 821-5700
Grades: 6-8
| 1,013 students
Rank: #1010.
Pleasant Hill Middle School
(Math: 44% | Reading: 62%)
Rank:
Rank:
7/
Top 50%10
660 Rawl Road
Lexington, SC 29072
(803) 821-2700
Lexington, SC 29072
(803) 821-2700
Grades: 6-8
| 707 students
Rank: #1111.
Lexington Elementary School
(Math: 47% | Reading: 48%)
Rank:
Rank:
6/
Top 50%10
116 Azalea Drive
Lexington, SC 29072
(803) 821-4000
Lexington, SC 29072
(803) 821-4000
Grades: PK-5
| 656 students
Rank: #1212.
Oak Grove Elementary School
(Math: 45% | Reading: 51%)
Rank:
Rank:
6/
Top 50%10
479 Oak Drive
Lexington, SC 29073
(803) 821-0100
Lexington, SC 29073
(803) 821-0100
Grades: PK-5
| 704 students
Rank: #1313.
Lakeside Middle School
(Math: 39% | Reading: 56%)
Rank:
Rank:
6/
Top 50%10
455 Old Cherokee Road
Lexington, SC 29072
(803) 821-3700
Lexington, SC 29072
(803) 821-3700
Grades: 6-8
| 892 students
Rank: #1414.
Saxe Gotha Elementary School
(Math: 46% | Reading: 47%)
Rank:
Rank:
6/
Top 50%10
100 Bill Williamson Court
Lexington, SC 29073
(803) 821-4800
Lexington, SC 29073
(803) 821-4800
Grades: PK-5
| 582 students
Rank: #1515.
Centerville Elementary School
(Math: 45% | Reading: 45%)
Rank:
Rank:
5/
Bottom 50%10
4147 Augusta Highway
Gilbert, SC 29054
(803) 821-1610
Gilbert, SC 29054
(803) 821-1610
Grades: PK-5
| 809 students
Rank: #1616.
Red Bank Elementary School
(Math: 36% | Reading: 46%)
Rank:
Rank:
5/
Bottom 50%10
246 Community Drive
Lexington, SC 29073
(803) 821-4600
Lexington, SC 29073
(803) 821-4600
Grades: PK-5
| 540 students
Rank: #1717.
Gilbert Elementary School
(Math: 43% | Reading: 37%)
Rank:
Rank:
5/
Bottom 50%10
320 Main Street
Gilbert, SC 29054
(803) 821-1600
Gilbert, SC 29054
(803) 821-1600
Grades: PK-5
| 804 students
Rank: #1818.
Carolina Springs Middle School
(Math: 31% | Reading: 46%)
Rank:
Rank:
4/
Bottom 50%10
6180 Platt Springs Road
Lexington, SC 29073
(803) 821-4900
Lexington, SC 29073
(803) 821-4900
Grades: 6-8
| 805 students
Rank: #1919.
Carolina Springs Elementary School
(Math: 32% | Reading: 43%)
Rank:
Rank:
4/
Bottom 50%10
6340 Platt Springs Road
Lexington, SC 29073
(803) 821-5100
Lexington, SC 29073
(803) 821-5100
Grades: PK-5
| 750 students
Rank: #2020.
White Knoll Elementary School
(Math: 34% | Reading: 37%)
Rank:
Rank:
4/
Bottom 50%10
132 White Knoll Way
West Columbia, SC 29170
(803) 821-4500
West Columbia, SC 29170
(803) 821-4500
Grades: PK-5
| 607 students
Rank: #2121.
Forts Pond Elementary School
(Math: 33% | Reading: 32%)
Rank:
Rank:
3/
Bottom 50%10
7350 Fish Hatchery Road
Pelion, SC 29123
(803) 821-2500
Pelion, SC 29123
(803) 821-2500
Grades: PK-5
| 505 students
Rank: #2222.
Gilbert Middle School
(Math: 26% | Reading: 37%)
Rank:
Rank:
3/
Bottom 50%10
120 Rikard Circle
Gilbert, SC 29054
(803) 821-1700
Gilbert, SC 29054
(803) 821-1700
Grades: 6-8
| 831 students
Rank: #2323.
White Knoll Middle School
(Math: 21% | Reading: 39%)
Rank:
Rank:
3/
Bottom 50%10
116 White Knoll Way
West Columbia, SC 29170
(803) 821-4300
West Columbia, SC 29170
(803) 821-4300
Grades: 6-8
| 696 students
Rank: #2424.
Pelion Elementary School
(Math: 21% | Reading: 29%)
Rank:
Rank:
2/
Bottom 50%10
1202 Pine Street
Pelion, SC 29123
(803) 821-2000
Pelion, SC 29123
(803) 821-2000
Grades: PK-5
| 632 students
Rank: #2525.
Pelion Middle School
(Math: 15% | Reading: 24%)
Rank:
Rank:
1/
Bottom 50%10
758 Magnolia Street
Pelion, SC 29123
(803) 821-2300
Pelion, SC 29123
(803) 821-2300
Grades: 6-8
| 560 students
Recent Articles

Year-Round Or Traditional Schedule?
Which is more appropriate for your child? A year-round attendance schedule or traditional schedule? We look at the pros and cons.

Why You Should Encourage Your Child to Join a Sports Team
Participating in team sports has a great many benefits for children, there is no doubt. In this article you will learn what those benefits are.

White Students are Now the Minority in U.S. Public Schools
Increasing birth rates among immigrant families from Asia and Central and South America, combined with lower birth rates among white families, means that for the first time in history, public school students in the United States are majority-minority. This shift in demographics poses difficulties for schools as they work to accommodate children of varying language abilities and socio-economic backgrounds.


