Top Rankings
Richland 01 School District ranks among the top 20% of public school district in South Carolina for:
Category
Attribute
Community Size
Largest student body (number of students) (Top 1%)
Student Attention
Lowest student:teacher ratio (Top 1%)
For the 2025 school year, there are 39 public elementary schools serving 15,844 students in Richland 01 School District. This district's average elementary testing ranking is 3/10, which is in the bottom 50% of public elementary schools in South Carolina.
Public Elementary Schools in Richland 01 School District have an average math proficiency score of 27% (versus the South Carolina public elementary school average of 39%), and reading proficiency score of 36% (versus the 47% statewide average).
Minority enrollment is 82% of the student body (majority Black), which is more than the South Carolina public elementary school average of 53% (majority Black).
Overview
This School District
This State (SC)
# Schools
48 Schools
965 Schools
# Students
22,123 Students
551,243 Students
# Teachers
1,763 Teachers
39,892 Teachers
Student : Teacher Ratio
13:1
13:1
District Rank
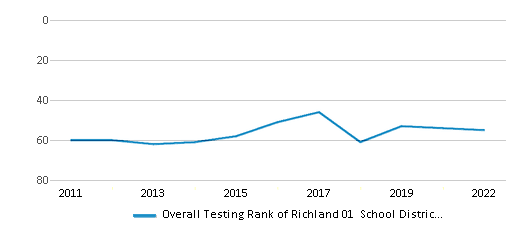
Richland 01 School District, which is ranked within the bottom 50% of all 76 school districts in South Carolina (based off of combined math and reading proficiency testing data) for the 2021-2022 school year.
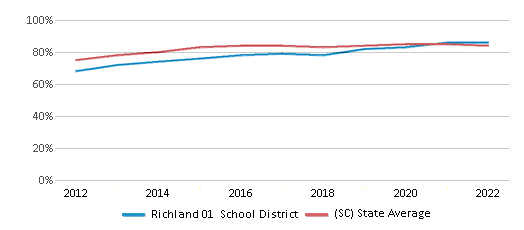
The school district's graduation rate of 86% has increased from 79% over five school years.
Overall District Rank
#55 out of 81 school districts
(Bottom 50%)
(Bottom 50%)
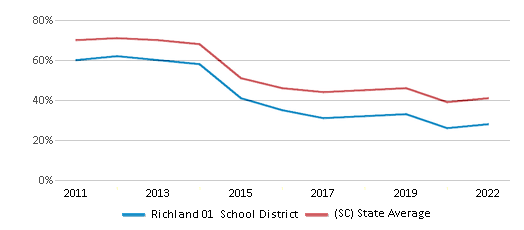
Math Test Scores (% Proficient)
28%
41%
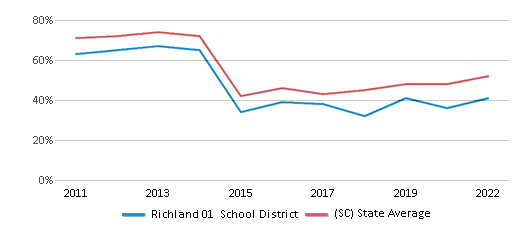
Reading/Language Arts Test Scores (% Proficient)
41%
52%
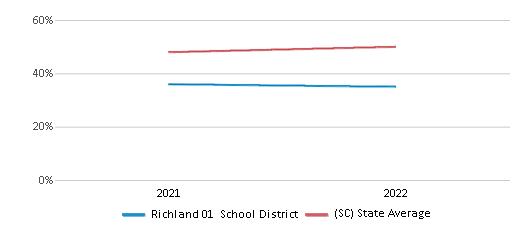
Science Test Scores (% Proficient)
35%
50%
Graduation Rate
86%
84%
Students by Ethnicity:
Diversity Score
0.51
0.67
# American Indian Students
6 Students
1,609 Students
% American Indian Students
n/a
n/a
# Asian Students
230 Students
10,166 Students
% Asian Students
1%
2%
# Hispanic Students
1,759 Students
74,117 Students
% Hispanic Students
8%
13%
# Black Students
14,853 Students
170,518 Students
% Black Students
67%
31%
# White Students
4,042 Students
258,372 Students
% White Students
18%
47%
# Hawaiian Students
21 Students
663 Students
% Hawaiian Students
n/a
n/a
# Two or more races Students
1,212 Students
35,675 Students
% of Two or more races Students
6%
7%
Students by Grade:
# Students in PK Grade:
1,141
24,436
# Students in K Grade:
1,606
53,057
# Students in 1st Grade:
1,637
56,847
# Students in 2nd Grade:
1,716
58,232
# Students in 3rd Grade:
1,664
57,411
# Students in 4th Grade:
1,668
57,861
# Students in 5th Grade:
1,609
58,020
# Students in 6th Grade:
1,654
58,906
# Students in 7th Grade:
1,579
54,750
# Students in 8th Grade:
1,520
55,491
# Students in 9th Grade:
2,038
4,594
# Students in 10th Grade:
1,644
4,219
# Students in 11th Grade:
1,435
3,860
# Students in 12th Grade:
1,212
3,559
# Ungraded Students:
-
-
District Revenue and Spending
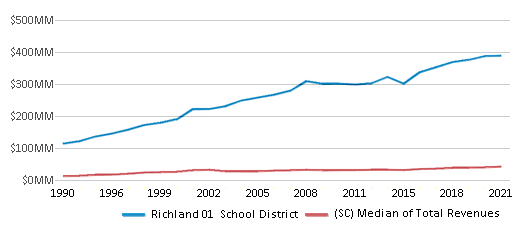
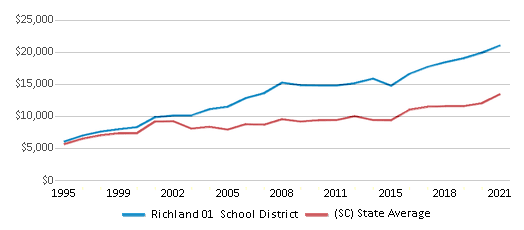
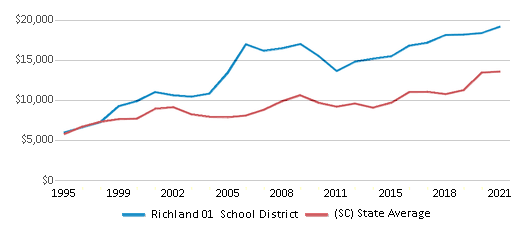
The revenue/student of $21,128 is higher than the state median of $15,220. The school district revenue/student has stayed relatively flat over four school years.
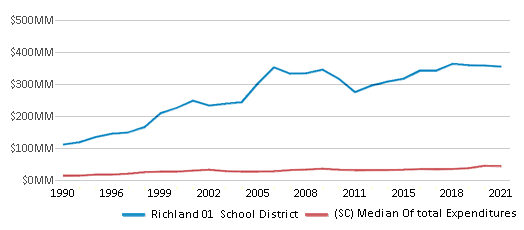
The school district's spending/student of $19,259 is higher than the state median of $14,817. The school district spending/student has stayed relatively flat over four school years.
Total Revenue
$467 MM
$12,084 MM
Spending
$426 MM
$11,764 MM
Revenue / Student
$21,128
$15,220
Spending / Student
$19,259
$14,817
Best Richland 01 School District Public Elementary Schools (2025)
School
(Math and Reading Proficiency)
(Math and Reading Proficiency)
Location
Grades
Students
Rank: #11.
Brockman Elementary School
(Math: 75-79% | Reading: 80-84%)
Rank:
Rank:
10/
Top 5%10
2245 Montclair Drive
Columbia, SC 29206
(803) 790-6743
Columbia, SC 29206
(803) 790-6743
Grades: PK-5
| 266 students
Rank: #22.
Rosewood Elementary School
(Math: 65-69% | Reading: 70-74%)
Rank:
Rank:
9/
Top 20%10
3300 Rosewood Drive
Columbia, SC 29205
(803) 343-2930
Columbia, SC 29205
(803) 343-2930
Grades: K-5
| 343 students
Rank: #33.
Satchel Ford Elementary School
(Math: 68% | Reading: 70%)
Rank:
Rank:
9/
Top 20%10
5901 Satchel Ford Road
Columbia, SC 29206
(803) 738-7209
Columbia, SC 29206
(803) 738-7209
Grades: K-5
| 698 students
Rank: #44.
Brennen Elementary School
(Math: 61% | Reading: 64%)
Rank:
Rank:
8/
Top 30%10
4438 Devereaux Road
Columbia, SC 29205
(803) 738-7204
Columbia, SC 29205
(803) 738-7204
Grades: PK-5
| 792 students
Rank: #55.
Crayton Middle School
(Math: 49% | Reading: 60%)
Rank:
Rank:
7/
Top 50%10
5000 Clemson Avenue
Columbia, SC 29206
(803) 738-7224
Columbia, SC 29206
(803) 738-7224
Grades: 6-8
| 924 students
Rank: #66.
Pendergrass Fairwold School
Special Education School
(Math: <50% | Reading: ≥50%)
Rank:
Rank:
6/
Top 50%10
5935 Token Street
Columbia, SC 29203
(803) 735-3435
Columbia, SC 29203
(803) 735-3435
Grades: PK-12
| 56 students
Rank: #77.
Logan Elementary School
(Math: 35-39% | Reading: 50-54%)
Rank:
Rank:
5/
Bottom 50%10
815 Elmwood Avenue
Columbia, SC 29201
(803) 343-2915
Columbia, SC 29201
(803) 343-2915
Grades: PK-5
| 221 students
Rank: #88.
A. C. Moore Elementary School
(Math: 40-44% | Reading: 40-44%)
Rank:
Rank:
5/
Bottom 50%10
333 Etiwan Avenue
Columbia, SC 29205
(803) 343-2910
Columbia, SC 29205
(803) 343-2910
Grades: PK-5
| 224 students
Rank: #99.
Hand Middle School
(Math: 34% | Reading: 44%)
Rank:
Rank:
4/
Bottom 50%10
2600 Wheat Street
Columbia, SC 29205
(803) 343-2947
Columbia, SC 29205
(803) 343-2947
Grades: 6-8
| 700 students
Rank: #1010.
Meadowfield Elementary School
(Math: 36% | Reading: 41%)
Rank:
Rank:
4/
Bottom 50%10
525 Galway Lane
Columbia, SC 29209
(803) 738-5549
Columbia, SC 29209
(803) 738-5549
Grades: PK-5
| 610 students
Rank: #1111.
Gadsden Elementary School
(Math: 30-39% | Reading: 30-39%)
Rank:
Rank:
3/
Bottom 50%10
1660 South Goodwin Circle
Gadsden, SC 29052
(803) 353-2231
Gadsden, SC 29052
(803) 353-2231
Grades: PK-5
| 134 students
Rank: #1212.
Hopkins Elementary School
(Math: 35-39% | Reading: 25-29%)
Rank:
Rank:
3/
Bottom 50%10
6120 Cabin Creek Road
Hopkins, SC 29061
(803) 783-5541
Hopkins, SC 29061
(803) 783-5541
Grades: PK-5
| 251 students
Rank: #13 - 1413. - 14.
Bradley Elementary School
Magnet School
(Math: 25-29% | Reading: 35-39%)
Rank:
Rank:
3/
Bottom 50%10
3032 Pinebelt Road
Columbia, SC 29204
(803) 738-7200
Columbia, SC 29204
(803) 738-7200
Grades: PK-5
| 413 students
Rank: #13 - 1413. - 14.
Carver-lyon Elementary School
Magnet School
(Math: 25-29% | Reading: 35-39%)
Rank:
Rank:
3/
Bottom 50%10
2100 Waverly Street
Columbia, SC 29204
(803) 343-2900
Columbia, SC 29204
(803) 343-2900
Grades: PK-5
| 360 students
Rank: #15 - 1615. - 16.
Annie Burnside Elementary School
(Math: 25-29% | Reading: 30-34%)
Rank:
Rank:
3/
Bottom 50%10
7300 Patterson Road
Columbia, SC 29209
(803) 783-5530
Columbia, SC 29209
(803) 783-5530
Grades: PK-5
| 319 students
Rank: #15 - 1615. - 16.
South Kilbourne Elementary School
(Math: 25-29% | Reading: 30-34%)
Rank:
Rank:
3/
Bottom 50%10
1400 South Kilbourne Road
Columbia, SC 29205
(803) 738-7215
Columbia, SC 29205
(803) 738-7215
Grades: PK-5
| 289 students
Rank: #1717.
W. G. Sanders Middle School
Magnet School
(Math: 19% | Reading: 41%)
Rank:
Rank:
3/
Bottom 50%10
3455 Pine Belt Road
Columbia, SC 29204
(803) 735-7575
Columbia, SC 29204
(803) 735-7575
Grades: 6-8
| 524 students
Rank: #1818.
H. B. Rhame Elementary School
(Math: 26% | Reading: 32%)
Rank:
Rank:
3/
Bottom 50%10
1300 Arrowwood Drive
Columbia, SC 29210
(803) 731-8900
Columbia, SC 29210
(803) 731-8900
Grades: PK-5
| 470 students
Rank: #1919.
Horrell Hill Elementary School
(Math: 23% | Reading: 27%)
Rank:
Rank:
2/
Bottom 50%10
517 Horrell Hill Road
Hopkins, SC 29061
(803) 783-5545
Hopkins, SC 29061
(803) 783-5545
Grades: PK-5
| 589 students
Rank: #20 - 2120. - 21.
Mill Creek Elementary School
(Math: 20-24% | Reading: 25-29%)
Rank:
Rank:
2/
Bottom 50%10
925 Universal Drive
Columbia, SC 29209
(803) 783-5553
Columbia, SC 29209
(803) 783-5553
Grades: PK-5
| 329 students
Rank: #20 - 2120. - 21.
Webber School
(Math: 20-24% | Reading: 25-29%)
Rank:
Rank:
2/
Bottom 50%10
140 Webber School Road
Eastover, SC 29044
(803) 353-8771
Eastover, SC 29044
(803) 353-8771
Grades: PK-5
| 202 students
Rank: #2222.
Carolina School For Inquiry
Charter School
(Math: 11-19% | Reading: 30-39%)
Rank:
Rank:
2/
Bottom 50%10
7405-a Fairfield Road
Columbia, SC 29202
(803) 691-1250
Columbia, SC 29202
(803) 691-1250
Grades: PK-6
| 113 students
Rank: #2323.
Sandel Elementary School
(Math: 22% | Reading: 25%)
Rank:
Rank:
2/
Bottom 50%10
2700 Seminole Road
Columbia, SC 29210
(803) 731-8906
Columbia, SC 29210
(803) 731-8906
Grades: PK-5
| 507 students
Rank: #2424.
Caughman Road Elementary School
(Math: 19% | Reading: 28%)
Rank:
Rank:
2/
Bottom 50%10
7725 Caughman Road
Columbia, SC 29209
(803) 783-5534
Columbia, SC 29209
(803) 783-5534
Grades: PK-5
| 742 students
Rank: #25 - 2725. - 27.
Burton Pack Elementary School
(Math: 20-24% | Reading: 20-24%)
Rank:
Rank:
2/
Bottom 50%10
111 Garden Drive
Columbia, SC 29204
(803) 691-5550
Columbia, SC 29204
(803) 691-5550
Grades: PK-5
| 344 students
Rank: #25 - 2725. - 27.
Forest Heights Elementary School
(Math: 20-24% | Reading: 20-24%)
Rank:
Rank:
2/
Bottom 50%10
2500 Blue Ridge Terrace
Columbia, SC 29203
(803) 691-3780
Columbia, SC 29203
(803) 691-3780
Grades: PK-5
| 433 students
Rank: #25 - 2725. - 27.
J. P. Thomas Elementary School
(Math: 20-24% | Reading: 20-24%)
Rank:
Rank:
2/
Bottom 50%10
6001 Weston Avenue
Columbia, SC 29203
(803) 735-3430
Columbia, SC 29203
(803) 735-3430
Grades: PK-5
| 302 students
Rank: #2828.
Arden Elementary School
(Math: 20-24% | Reading: 15-19%)
Rank:
Rank:
2/
Bottom 50%10
1300 Ashley Street
Columbia, SC 29203
(803) 735-3400
Columbia, SC 29203
(803) 735-3400
Grades: PK-5
| 227 students
Rank: #2929.
Hopkins Middle School
(Math: 13% | Reading: 27%)
Rank:
Rank:
2/
Bottom 50%10
1601 Clarkson Road
Hopkins, SC 29061
(803) 695-3331
Hopkins, SC 29061
(803) 695-3331
Grades: 6-8
| 463 students
Rank: #3030.
Watkins-nance Elementary School
(Math: 10-14% | Reading: 25-29%)
Rank:
Rank:
2/
Bottom 50%10
2525 Barhamville Road
Columbia, SC 29204
(803) 733-4321
Columbia, SC 29204
(803) 733-4321
Grades: PK-5
| 435 students
Rank: #3131.
Edward E. Taylor Elementary School
(Math: 15-19% | Reading: 20-24%)
Rank:
Rank:
1/
Bottom 50%10
200 Mcrae Street
Columbia, SC 29203
(803) 343-2974
Columbia, SC 29203
(803) 343-2974
Grades: PK-5
| 222 students
Rank: #3232.
Pine Grove Elementary School
(Math: 14% | Reading: 22%)
Rank:
Rank:
1/
Bottom 50%10
111 Huffstetler Drive
Columbia, SC 29210
(803) 214-2380
Columbia, SC 29210
(803) 214-2380
Grades: PK-5
| 530 students
Rank: #3333.
A. J. Lewis Greenview Elementary School
(Math: 15-19% | Reading: 15-19%)
Rank:
Rank:
1/
Bottom 50%10
726 Easter Street
Columbia, SC 29203
(803) 735-3417
Columbia, SC 29203
(803) 735-3417
Grades: PK-5
| 353 students
Rank: #3434.
Southeast Middle School
(Math: 8% | Reading: 26%)
Rank:
Rank:
1/
Bottom 50%10
731 Horrell Hill Road
Hopkins, SC 29061
(803) 695-5700
Hopkins, SC 29061
(803) 695-5700
Grades: 6-8
| 469 students
Rank: #3535.
St. Andrews Middle School
(Math: 10% | Reading: 24%)
Rank:
Rank:
1/
Bottom 50%10
1231 Bluefield Road
Columbia, SC 29210
(803) 731-8910
Columbia, SC 29210
(803) 731-8910
Grades: 6-8
| 700 students
Show 4 more public schools in Richland 01 School District (out of 39 total schools)
Loading...
Recent Articles

Year-Round Or Traditional Schedule?
Which is more appropriate for your child? A year-round attendance schedule or traditional schedule? We look at the pros and cons.

Why You Should Encourage Your Child to Join a Sports Team
Participating in team sports has a great many benefits for children, there is no doubt. In this article you will learn what those benefits are.

White Students are Now the Minority in U.S. Public Schools
Increasing birth rates among immigrant families from Asia and Central and South America, combined with lower birth rates among white families, means that for the first time in history, public school students in the United States are majority-minority. This shift in demographics poses difficulties for schools as they work to accommodate children of varying language abilities and socio-economic backgrounds.


