Top Rankings
York 03 School District ranks among the top 20% of public school district in South Carolina for:
Category
Attribute
Diversity
Most diverse schools (Top 1%)
Community Size
Largest student body (number of students) (Top 1%)
For the 2025 school year, there are 20 public elementary schools serving 11,151 students in York 03 School District. This district's average elementary testing ranking is 7/10, which is in the top 50% of public elementary schools in South Carolina.
Public Elementary Schools in York 03 School District have an average math proficiency score of 35% (versus the South Carolina public elementary school average of 39%), and reading proficiency score of 44% (versus the 47% statewide average).
Minority enrollment is 62% of the student body (majority Black), which is more than the South Carolina public elementary school average of 53% (majority Black).
Overview
This School District
This State (SC)
# Schools
25 Schools
965 Schools
# Students
16,316 Students
551,243 Students
# Teachers
1,146 Teachers
39,892 Teachers
Student : Teacher Ratio
15:1
15:1
District Rank
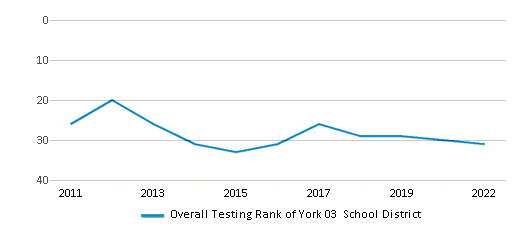
York 03 School District, which is ranked within the top 50% of all 76 school districts in South Carolina (based off of combined math and reading proficiency testing data) for the 2021-2022 school year.
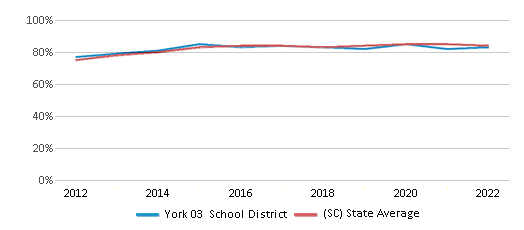
The school district's graduation rate of 83% has decreased from 84% over five school years.
Overall District Rank
#31 out of 81 school districts
(Top 50%)
(Top 50%)
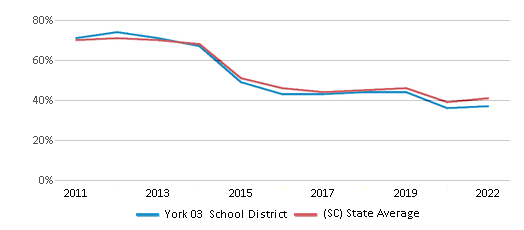
Math Test Scores (% Proficient)
37%
41%
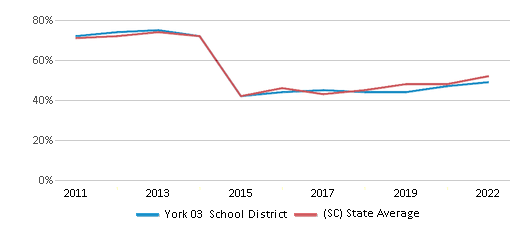
Reading/Language Arts Test Scores (% Proficient)
49%
52%
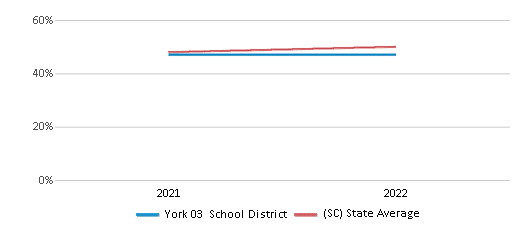
Science Test Scores (% Proficient)
47%
50%
Graduation Rate
83%
84%
Students by Ethnicity:
Diversity Score
0.68
0.67
# American Indian Students
183 Students
1,609 Students
% American Indian Students
1%
n/a
# Asian Students
232 Students
10,166 Students
% Asian Students
2%
2%
# Hispanic Students
2,130 Students
74,117 Students
% Hispanic Students
13%
13%
# Black Students
6,534 Students
170,518 Students
% Black Students
40%
31%
# White Students
6,178 Students
258,372 Students
% White Students
38%
47%
# Hawaiian Students
17 Students
663 Students
% Hawaiian Students
n/a
n/a
# Two or more races Students
1,042 Students
35,675 Students
% of Two or more races Students
6%
7%
Students by Grade:
# Students in PK Grade:
490
24,436
# Students in K Grade:
1,123
53,057
# Students in 1st Grade:
1,153
56,847
# Students in 2nd Grade:
1,192
58,232
# Students in 3rd Grade:
1,144
57,411
# Students in 4th Grade:
1,223
57,861
# Students in 5th Grade:
1,216
58,020
# Students in 6th Grade:
1,266
58,906
# Students in 7th Grade:
1,275
54,750
# Students in 8th Grade:
1,291
55,491
# Students in 9th Grade:
1,500
4,594
# Students in 10th Grade:
1,337
4,219
# Students in 11th Grade:
1,147
3,860
# Students in 12th Grade:
959
3,559
# Ungraded Students:
-
-
District Revenue and Spending
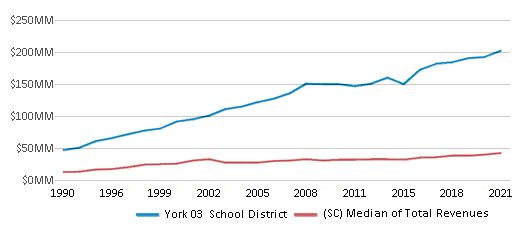
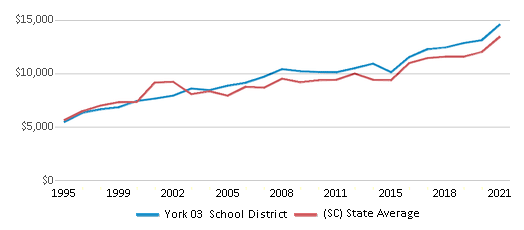
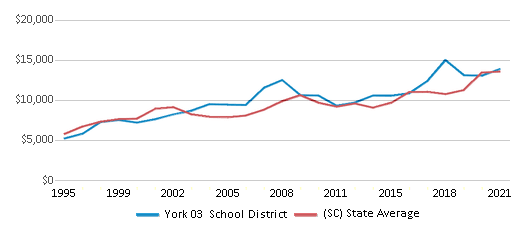
The revenue/student of $14,910 in this school district is less than the state median of $15,220. The school district revenue/student has stayed relatively flat over four school years.
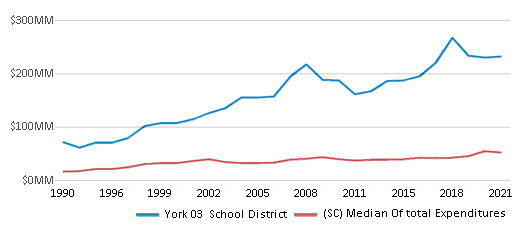
The school district's spending/student of $14,196 is less than the state median of $14,817. The school district spending/student has stayed relatively flat over four school years.
Total Revenue
$243 MM
$12,084 MM
Spending
$232 MM
$11,764 MM
Revenue / Student
$14,910
$15,220
Spending / Student
$14,196
$14,817
Best York 03 School District Public Elementary Schools (2025)
School
(Math and Reading Proficiency)
(Math and Reading Proficiency)
Location
Grades
Students
Rank: #11.
Cherry Park Elementary School Of Language Immersion
(Math: 65% | Reading: 72%)
Rank:
Rank:
9/
Top 20%10
1835 Eden Terrace
Rock Hill, SC 29730
(803) 985-2255
Rock Hill, SC 29730
(803) 985-2255
Grades: K-5
| 815 students
Rank: #22.
Mount Gallant Elementary School
(Math: 58% | Reading: 59%)
Rank:
Rank:
8/
Top 30%10
4664 Mount Gallant Road
Rock Hill, SC 29732
(803) 981-1360
Rock Hill, SC 29732
(803) 981-1360
Grades: K-5
| 502 students
Rank: #33.
Lesslie Elementary School
(Math: 50% | Reading: 52%)
Rank:
Rank:
7/
Top 50%10
250 Neely Store Road
Rock Hill, SC 29730
(803) 981-1910
Rock Hill, SC 29730
(803) 981-1910
Grades: PK-5
| 481 students
Rank: #44.
India Hook Elementary School
(Math: 49% | Reading: 51%)
Rank:
Rank:
6/
Top 50%10
2068 Yukon Drive
Rock Hill, SC 29732
(803) 985-1600
Rock Hill, SC 29732
(803) 985-1600
Grades: K-5
| 544 students
Rank: #55.
Ebenezer Avenue Elementary Traditional Montesorri Inquiry
(Math: 47% | Reading: 48%)
Rank:
Rank:
6/
Top 50%10
242 Ebenezer Avenue
Rock Hill, SC 29730
(803) 981-1435
Rock Hill, SC 29730
(803) 981-1435
Grades: PK-5
| 463 students
Rank: #66.
Old Pointe Elementary School
(Math: 45% | Reading: 50%)
Rank:
Rank:
6/
Top 50%10
380 Old Pointe School Road
Rock Hill, SC 29732
(803) 980-2040
Rock Hill, SC 29732
(803) 980-2040
Grades: PK-5
| 569 students
Rank: #77.
Mount Holly Elementary School
(Math: 44% | Reading: 50%)
Rank:
Rank:
6/
Top 50%10
1800 Porter Road
Rock Hill, SC 29730
(803) 985-1650
Rock Hill, SC 29730
(803) 985-1650
Grades: PK-5
| 532 students
Rank: #88.
Oakdale Elementary School
(Math: 43% | Reading: 45%)
Rank:
Rank:
5/
Bottom 50%10
1129 Oakdale Road
Rock Hill, SC 29730
(803) 981-1585
Rock Hill, SC 29730
(803) 981-1585
Grades: PK-5
| 482 students
Rank: #99.
Sunset Park Center For Accelerated Studies
(Math: 35% | Reading: 46%)
Rank:
Rank:
5/
Bottom 50%10
1036 Ogden Road
Rock Hill, SC 29730
(803) 981-1260
Rock Hill, SC 29730
(803) 981-1260
Grades: PK-5
| 465 students
Rank: #10 - 1110. - 11.
Northside Elementary School
(Math: 37% | Reading: 37%)
Rank:
Rank:
4/
Bottom 50%10
840 North Annafrel Street
Rock Hill, SC 29730
(803) 981-1570
Rock Hill, SC 29730
(803) 981-1570
Grades: PK-5
| 474 students
Rank: #10 - 1110. - 11.
Richmond Drive Elementary School
(Math: 35-39% | Reading: 35-39%)
Rank:
Rank:
4/
Bottom 50%10
1162 Richmond Drive
Rock Hill, SC 29732
(803) 981-1930
Rock Hill, SC 29732
(803) 981-1930
Grades: PK-5
| 496 students
Rank: #1212.
Ebinport Elementary School
(Math: 35% | Reading: 40%)
Rank:
Rank:
4/
Bottom 50%10
2142 India Hook Road
Rock Hill, SC 29732
(803) 981-1550
Rock Hill, SC 29732
(803) 981-1550
Grades: PK-5
| 459 students
Rank: #1313.
Dutchman Creek Middle School
(Math: 29% | Reading: 44%)
Rank:
Rank:
4/
Bottom 50%10
4757 Mount Gallant Road
Rock Hill, SC 29732
(803) 985-1700
Rock Hill, SC 29732
(803) 985-1700
Grades: 6-8
| 868 students
Rank: #1414.
York Road Elementary School
(Math: 35% | Reading: 37%)
Rank:
Rank:
4/
Bottom 50%10
2254 West Main Street
Rock Hill, SC 29732
(803) 981-1950
Rock Hill, SC 29732
(803) 981-1950
Grades: PK-5
| 436 students
Rank: #1515.
Independence Elementary School
(Math: 32% | Reading: 38%)
Rank:
Rank:
4/
Bottom 50%10
132 West Springdale Road
Rock Hill, SC 29730
(803) 981-1135
Rock Hill, SC 29730
(803) 981-1135
Grades: PK-5
| 558 students
Rank: #1616.
Saluda Trail Middle School
(Math: 26% | Reading: 42%)
Rank:
Rank:
3/
Bottom 50%10
2300 Saluda Road
Rock Hill, SC 29730
(803) 981-1800
Rock Hill, SC 29730
(803) 981-1800
Grades: 6-8
| 780 students
Rank: #1717.
W. C. Sullivan Middle School
(Math: 26% | Reading: 39%)
Rank:
Rank:
3/
Bottom 50%10
1825 Eden Terrace
Rock Hill, SC 29730
(803) 981-1450
Rock Hill, SC 29730
(803) 981-1450
Grades: 6-8
| 805 students
Rank: #18 - 1918. - 19.
Castle Heights Middle School
(Math: 23% | Reading: 35%)
Rank:
Rank:
3/
Bottom 50%10
2382 Firetower Road
Rock Hill, SC 29730
(803) 981-1400
Rock Hill, SC 29730
(803) 981-1400
Grades: 6-8
| 710 students
Rank: #18 - 1918. - 19.
Rawlinson Road Middle School
(Math: 24% | Reading: 34%)
Rank:
Rank:
3/
Bottom 50%10
2631 West Main Street
Rock Hill, SC 29732
(803) 981-1500
Rock Hill, SC 29732
(803) 981-1500
Grades: 6-8
| 654 students
Rank: #2020.
The Palmetto School
Charter School
(Math: ≤20% | Reading: ≤20%)
Rank:
Rank:
1/
Bottom 50%10
386 East Black Street
Rock Hill, SC 29732
(803) 328-6555
Rock Hill, SC 29732
(803) 328-6555
Grades: PK-8
| 58 students
Recent Articles

Year-Round Or Traditional Schedule?
Which is more appropriate for your child? A year-round attendance schedule or traditional schedule? We look at the pros and cons.

Why You Should Encourage Your Child to Join a Sports Team
Participating in team sports has a great many benefits for children, there is no doubt. In this article you will learn what those benefits are.

White Students are Now the Minority in U.S. Public Schools
Increasing birth rates among immigrant families from Asia and Central and South America, combined with lower birth rates among white families, means that for the first time in history, public school students in the United States are majority-minority. This shift in demographics poses difficulties for schools as they work to accommodate children of varying language abilities and socio-economic backgrounds.


