Top Rankings
Davidson County School District ranks among the top 20% of public school district in Tennessee for:
Category
Attribute
Diversity
Most diverse schools (Top 1%)
Community Size
Largest student body (number of students) (Top 1%)
For the 2025 school year, there are 129 public elementary schools serving 59,128 students in Davidson County School District. This district's average elementary testing ranking is 2/10, which is in the bottom 50% of public elementary schools in Tennessee.
Public Elementary Schools in Davidson County School District have an average math proficiency score of 22% (versus the Tennessee public elementary school average of 35%), and reading proficiency score of 26% (versus the 36% statewide average).
Minority enrollment is 75% of the student body (majority Black and Hispanic), which is more than the Tennessee public elementary school average of 43% (majority Black).
Overview
This School District
This State (TN)
# Schools
165 Schools
1,500 Schools
# Students
80,888 Students
719,413 Students
# Teachers
4,914 Teachers
48,388 Teachers
Student : Teacher Ratio
16:1
16:1
District Rank
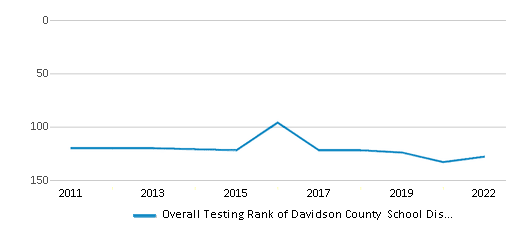
Davidson County School District, which is ranked within the bottom 50% of all 147 school districts in Tennessee (based off of combined math and reading proficiency testing data) for the 2021-2022 school year.
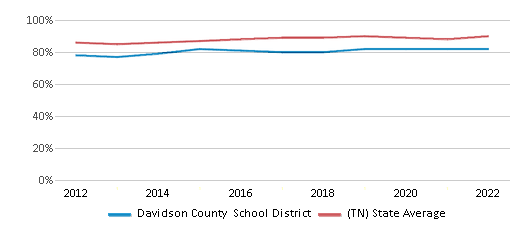
The school district's graduation rate of 82% has increased from 80% over five school years.
Overall District Rank
#128 out of 147 school districts
(Bottom 50%)
(Bottom 50%)
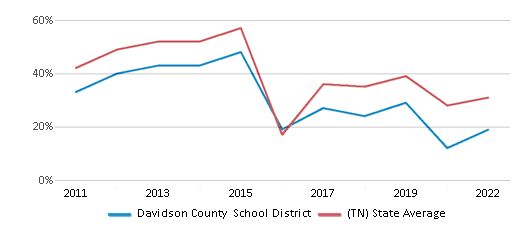
Math Test Scores (% Proficient)
19%
31%
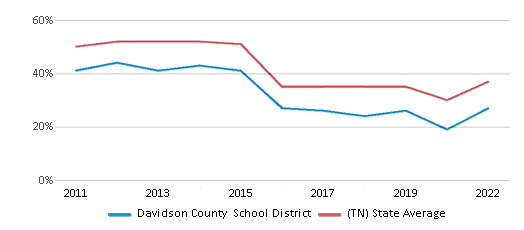
Reading/Language Arts Test Scores (% Proficient)
27%
37%
Science Test Scores (% Proficient)
24%
40%
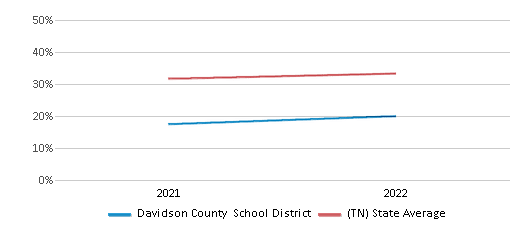
Graduation Rate
82%
90%
Students by Ethnicity:
Diversity Score
0.71
0.61
# American Indian Students
126 Students
1,225 Students
% American Indian Students
n/a
n/a
# Asian Students
2,698 Students
15,029 Students
% Asian Students
3%
2%
# Hispanic Students
26,929 Students
106,507 Students
% Hispanic Students
33%
15%
# Black Students
28,802 Students
149,772 Students
% Black Students
36%
21%
# White Students
19,428 Students
410,765 Students
% White Students
24%
57%
# Hawaiian Students
90 Students
856 Students
% Hawaiian Students
n/a
n/a
# Two or more races Students
2,815 Students
35,256 Students
% of Two or more races Students
4%
5%
Students by Grade:
# Students in PK Grade:
3,134
29,574
# Students in K Grade:
6,391
74,511
# Students in 1st Grade:
6,524
76,014
# Students in 2nd Grade:
6,586
77,971
# Students in 3rd Grade:
6,086
74,743
# Students in 4th Grade:
6,011
75,052
# Students in 5th Grade:
5,914
75,941
# Students in 6th Grade:
5,466
75,064
# Students in 7th Grade:
5,533
70,062
# Students in 8th Grade:
5,528
69,763
# Students in 9th Grade:
5,793
5,469
# Students in 10th Grade:
6,340
5,392
# Students in 11th Grade:
5,980
4,910
# Students in 12th Grade:
5,602
4,947
# Ungraded Students:
-
-
District Revenue and Spending
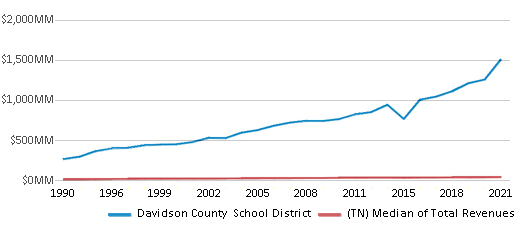
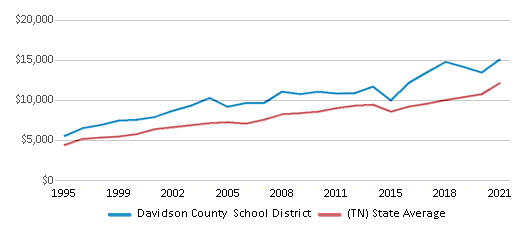
The revenue/student of $18,651 is higher than the state median of $11,979. The school district revenue/student has stayed relatively flat over four school years.
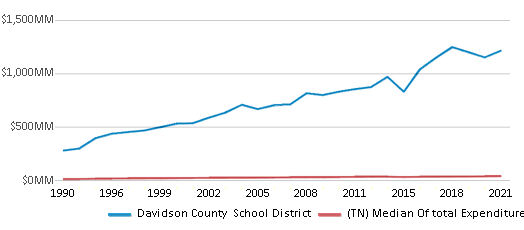
The school district's spending/student of $15,024 is higher than the state median of $11,478. The school district spending/student has stayed relatively flat over four school years.
Total Revenue
$1,509 MM
$12,104 MM
Spending
$1,215 MM
$11,597 MM
Revenue / Student
$18,651
$11,979
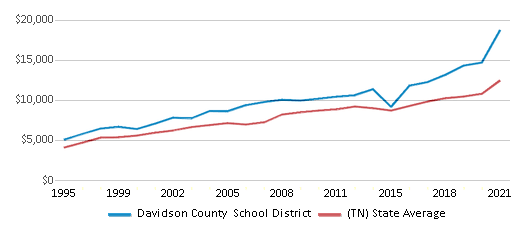
Spending / Student
$15,024
$11,478
Best Davidson County School District Public Elementary Schools (2025)
School
(Math and Reading Proficiency)
(Math and Reading Proficiency)
Location
Grades
Students
Rank: #11.
Lockeland Elementary School
Magnet School
(Math: 85-89% | Reading: 90-94%)
Rank:
Rank:
10/
Top 1%10
105 South 17th St
Nashville, TN 37206
(615) 258-1330
Nashville, TN 37206
(615) 258-1330
Grades: K-5
| 322 students
Rank: #22.
Meigs Middle School
Magnet School
(Math: 85% | Reading: 87%)
Rank:
Rank:
10/
Top 1%10
713 Ramsey St
Nashville, TN 37206
(615) 271-3222
Nashville, TN 37206
(615) 271-3222
Grades: 5-8
| 693 students
Rank: #33.
Julia Green Elementary School
Magnet School
(Math: 80-84% | Reading: 80-84%)
Rank:
Rank:
10/
Top 1%10
3500 Hobbs Rd
Nashville, TN 37215
(615) 298-8082
Nashville, TN 37215
(615) 298-8082
Grades: K-5
| 494 students
Rank: #4 - 54. - 5.
Glendale Elementary School
Magnet School
(Math: 75-79% | Reading: 75-79%)
Rank:
Rank:
10/
Top 5%10
800 Thompson Ave
Nashville, TN 37204
(615) 279-7970
Nashville, TN 37204
(615) 279-7970
Grades: PK-5
| 438 students
Rank: #4 - 54. - 5.
Percy Priest Elementary School
(Math: 75-79% | Reading: 75-79%)
Rank:
Rank:
10/
Top 5%10
1700 Otter Creek Rd
Nashville, TN 37215
(615) 298-8416
Nashville, TN 37215
(615) 298-8416
Grades: K-5
| 534 students
Rank: #66.
Harpeth Valley Elementary School
(Math: 65% | Reading: 66%)
Rank:
Rank:
10/
Top 5%10
7840 Learning Ln
Nashville, TN 37221
(615) 662-3015
Nashville, TN 37221
(615) 662-3015
Grades: PK-5
| 717 students
Rank: #77.
Crieve Hall Elementary School
(Math: 60-64% | Reading: 65-69%)
Rank:
Rank:
10/
Top 5%10
498 Hogan Rd
Nashville, TN 37220
(615) 333-5059
Nashville, TN 37220
(615) 333-5059
Grades: K-5
| 499 students
Rank: #88.
Valor Voyager Academy
Charter School
(Math: 64% | Reading: 55%)
Rank:
Rank:
10/
Top 10%10
4531 Nolensville Pike, Suite 1
Nashville, TN 37211
(615) 823-7982
Nashville, TN 37211
(615) 823-7982
Grades: 5-8
| 513 students
Rank: #99.
Stanford Elementary School
Magnet School
(Math: 55-59% | Reading: 55-59%)
Rank:
Rank:
10/
Top 10%10
2417 Maplecrest Dr
Nashville, TN 37214
(615) 885-8822
Nashville, TN 37214
(615) 885-8822
Grades: PK-5
| 435 students
Rank: #1010.
Valor Flagship Academy
Charter School
(Math: 53% | Reading: 60%)
Rank:
Rank:
10/
Top 10%10
4527 Nollensville Rd
Nashville, TN 37211
(615) 823-7982
Nashville, TN 37211
(615) 823-7982
Grades: 5-12
| 1,403 students
Rank: #1111.
Dan Mills Elementary School
(Math: 54% | Reading: 52%)
Rank:
Rank:
9/
Top 20%10
4106 Kennedy Ave
Nashville, TN 37216
(615) 262-6677
Nashville, TN 37216
(615) 262-6677
Grades: PK-5
| 604 students
Rank: #12 - 1312. - 13.
Purpose Prep
Charter School
(Math: 45-49% | Reading: 55-59%)
Rank:
Rank:
9/
Top 20%10
220 Venture Cir
Nashville, TN 37228
(615) 724-0705
Nashville, TN 37228
(615) 724-0705
Grades: K-5
| 419 students
Rank: #12 - 1312. - 13.
Waverly-belmont Elementary School
(Math: 45-49% | Reading: 55-59%)
Rank:
Rank:
9/
Top 20%10
2301 10th Ave South
Nashville, TN 37204
(615) 800-7690
Nashville, TN 37204
(615) 800-7690
Grades: K-5
| 528 students
Rank: #1414.
Nashville Classical East
Charter School
(Math: 52% | Reading: 48%)
Rank:
Rank:
9/
Top 20%10
2000 Greenwood Ave
Nashville, TN 37206
(615) 538-5841
Nashville, TN 37206
(615) 538-5841
Grades: K-8
| 537 students
Rank: #1515.
John Trotwood Moore Middle School
Magnet School
(Math: 49% | Reading: 51%)
Rank:
Rank:
9/
Top 20%10
4425 Granny White Pike
Nashville, TN 37204
(615) 298-8095
Nashville, TN 37204
(615) 298-8095
Grades: 6-8
| 409 students
Rank: #1616.
Granbery Elementary School
(Math: 46% | Reading: 55%)
Rank:
Rank:
9/
Top 20%10
5501 Hill Rd
Brentwood, TN 37027
(615) 333-5112
Brentwood, TN 37027
(615) 333-5112
Grades: K-4
| 651 students
Rank: #1717.
Sylvan Park Elementary School
Magnet School
(Math: 40-44% | Reading: 55-59%)
Rank:
Rank:
9/
Top 20%10
4801 Utah Ave
Nashville, TN 37209
(615) 298-8423
Nashville, TN 37209
(615) 298-8423
Grades: K-5
| 439 students
Rank: #1818.
Eakin Elementary School
(Math: 40-44% | Reading: 50-54%)
Rank:
Rank:
9/
Top 20%10
2500 Fairfax Ave
Nashville, TN 37212
(615) 298-8076
Nashville, TN 37212
(615) 298-8076
Grades: K-5
| 544 students
Rank: #1919.
Head Middle School
Magnet School
(Math: 41% | Reading: 52%)
Rank:
Rank:
9/
Top 20%10
1830 Jo Johnston Ave
Nashville, TN 37203
(615) 329-8160
Nashville, TN 37203
(615) 329-8160
Grades: 5-8
| 551 students
Rank: #2020.
Rose Park Middle School
Magnet School
(Math: 38% | Reading: 45%)
Rank:
Rank:
8/
Top 30%10
1025 9th Avenue South
Nashville, TN 37203
(615) 291-6405
Nashville, TN 37203
(615) 291-6405
Grades: 5-8
| 387 students
Rank: #2121.
Joelton Elementary School
(Math: 45-49% | Reading: 35-39%)
Rank:
Rank:
8/
Top 30%10
7141 Whites Creek Pike
Joelton, TN 37080
(615) 876-5110
Joelton, TN 37080
(615) 876-5110
Grades: PK-5
| 278 students
Rank: #2222.
Andrew Jackson Elementary School
(Math: 40-44% | Reading: 35-39%)
Rank:
Rank:
8/
Top 30%10
110 Shute Ln
Old Hickory, TN 37138
(615) 847-7317
Old Hickory, TN 37138
(615) 847-7317
Grades: PK-5
| 489 students
Rank: #2323.
West End Middle School
Magnet School
(Math: 35% | Reading: 44%)
Rank:
Rank:
8/
Top 30%10
3529 West End Ave
Nashville, TN 37205
(615) 298-8425
Nashville, TN 37205
(615) 298-8425
Grades: 6-8
| 332 students
Rank: #2424.
May Werthan Shayne Elementary School
(Math: 39% | Reading: 36%)
Rank:
Rank:
7/
Top 50%10
6217 Nolensville Rd
Nashville, TN 37211
(615) 332-3020
Nashville, TN 37211
(615) 332-3020
Grades: PK-4
| 704 students
Rank: #2525.
Gower Elementary School
(Math: 30-34% | Reading: 35-39%)
Rank:
Rank:
7/
Top 50%10
650 Old Hickory Blvd
Nashville, TN 37209
(615) 353-2012
Nashville, TN 37209
(615) 353-2012
Grades: PK-5
| 617 students
Rank: #2626.
Harris-hillman Special Education
Special Education School
(Math: <50% | Reading: ≤20%)
Rank:
Rank:
6/
Top 50%10
1706 26th Avenue South
Nashville, TN 37212
(615) 298-8085
Nashville, TN 37212
(615) 298-8085
Grades: PK-12
| 486 students
Rank: #2727.
Ruby Major Elementary School
(Math: 20-24% | Reading: 35-39%)
Rank:
Rank:
6/
Top 50%10
5141 John Hager Rd
Hermitage, TN 37076
(615) 232-2203
Hermitage, TN 37076
(615) 232-2203
Grades: PK-5
| 572 students
Rank: #2828.
Liberty Collegiate Academy
Charter School
(Math: 38% | Reading: 26%)
Rank:
Rank:
5/
Bottom 50%10
3515 Gallatin Rd
Nashville, TN 37206
(615) 564-1974
Nashville, TN 37206
(615) 564-1974
Grades: 5-8
| 267 students
Rank: #29 - 3129. - 31.
Old Center Elementary School
(Math: 25-29% | Reading: 30-34%)
Rank:
Rank:
5/
Bottom 50%10
1245 Dickerson Pike South
Goodlettsville, TN 37072
(615) 859-8968
Goodlettsville, TN 37072
(615) 859-8968
Grades: PK-5
| 351 students
Rank: #29 - 3129. - 31.
Rosebank Elementary School
(Math: 25-29% | Reading: 30-34%)
Rank:
Rank:
5/
Bottom 50%10
1012 Preston Dr
Nashville, TN 37206
(615) 262-6720
Nashville, TN 37206
(615) 262-6720
Grades: PK-5
| 440 students
Rank: #29 - 3129. - 31.
Westmeade Elementary School
(Math: 25-29% | Reading: 30-34%)
Rank:
Rank:
5/
Bottom 50%10
6641 Clearbrook Dr
Nashville, TN 37205
(615) 353-2066
Nashville, TN 37205
(615) 353-2066
Grades: K-5
| 466 students
Rank: #3232.
Charlotte Park Elementary School
(Math: 30-34% | Reading: 25-29%)
Rank:
Rank:
5/
Bottom 50%10
480 Annex Ave
Nashville, TN 37209
(615) 353-2006
Nashville, TN 37209
(615) 353-2006
Grades: PK-5
| 514 students
Rank: #3333.
Norman Binkley Elementary School
(Math: 25-29% | Reading: 25-29%)
Rank:
Rank:
5/
Bottom 50%10
4700 West Longdale Dr
Nashville, TN 37211
(615) 333-5037
Nashville, TN 37211
(615) 333-5037
Grades: PK-5
| 714 students
Rank: #3434.
Smithson Craighead Academy
Charter School
(Math: 30-34% | Reading: 20-24%)
Rank:
Rank:
4/
Bottom 50%10
730 Neely's Bend Rd
Madison, TN 37115
(615) 228-9886
Madison, TN 37115
(615) 228-9886
Grades: K-5
| 333 students
Rank: #3535.
East End Preparatory School
Charter School
(Math: 24% | Reading: 30%)
Rank:
Rank:
4/
Bottom 50%10
1460 Mcgavock Pike
Nashville, TN 37216
(615) 630-7470
Nashville, TN 37216
(615) 630-7470
Grades: K-8
| 756 students
Show 94 more public schools in Davidson County School District (out of 129 total schools)
Loading...
Recent Articles

What Is A Charter School?
Explore the world of charter schools in this comprehensive guide. Learn about their history, how they operate, and the pros and cons of this educational innovation. Discover key facts about charter schools, including admission policies, demographics, and funding, as well as what to look for when considering a charter school for your child.

10 Reasons Why High School Sports Benefit Students
Discover the 10 compelling reasons why high school sports are beneficial for students. This comprehensive article explores how athletics enhance academic performance, foster personal growth, and develop crucial life skills. From improved fitness and time management to leadership development and community representation, learn why participating in high school sports can be a game-changer for students' overall success and well-being.

February 05, 2025
Understanding the U.S. Department of Education: Structure, Impact, and EvolutionWe explore how the Department of Education shapes American education, from its cabinet-level leadership to its impact on millions of students, written for general audiences seeking clarity on this vital institution.


