Top Rankings
Davidson County School District ranks among the top 20% of public school district in Tennessee for:
Category
Attribute
Diversity
Most diverse schools (Top 1%)
Community Size
Largest student body (number of students) (Top 1%)
For the 2025 school year, there are 54 public middle schools serving 24,625 students in Davidson County School District. This district's average middle testing ranking is 3/10, which is in the bottom 50% of public middle schools in Tennessee.
Public Middle Schools in Davidson County School District have an average math proficiency score of 23% (versus the Tennessee public middle school average of 33%), and reading proficiency score of 27% (versus the 34% statewide average).
Minority enrollment is 75% of the student body (majority Black and Hispanic), which is more than the Tennessee public middle school average of 39% (majority Black).
Overview
This School District
This State (TN)
# Schools
165 Schools
672 Schools
# Students
80,888 Students
315,543 Students
# Teachers
4,914 Teachers
21,238 Teachers
Student : Teacher Ratio
16:1
16:1
District Rank
Davidson County School District, which is ranked within the bottom 50% of all 147 school districts in Tennessee (based off of combined math and reading proficiency testing data) for the 2021-2022 school year.
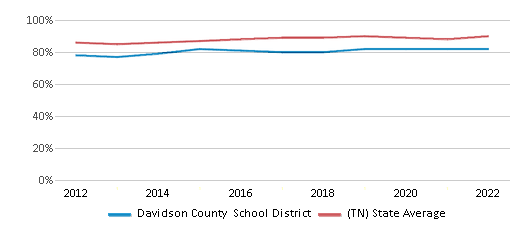
The school district's graduation rate of 82% has increased from 80% over five school years.
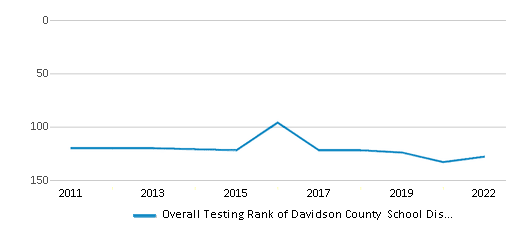
Overall District Rank
#128 out of 147 school districts
(Bottom 50%)
(Bottom 50%)
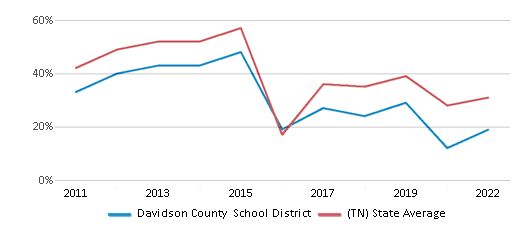
Math Test Scores (% Proficient)
19%
31%
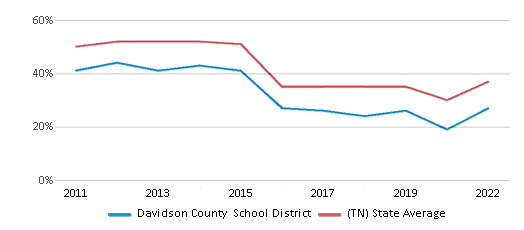
Reading/Language Arts Test Scores (% Proficient)
27%
37%
Science Test Scores (% Proficient)
24%
40%
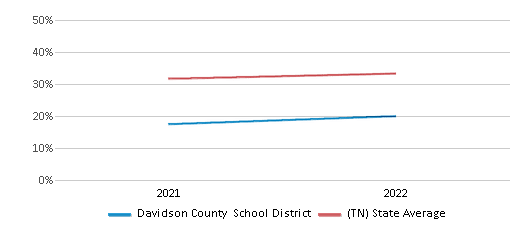
Graduation Rate
82%
90%
Students by Ethnicity:
Diversity Score
0.71
0.58
# American Indian Students
126 Students
486 Students
% American Indian Students
n/a
n/a
# Asian Students
2,698 Students
5,814 Students
% Asian Students
3%
2%
# Hispanic Students
26,929 Students
43,054 Students
% Hispanic Students
33%
14%
# Black Students
28,802 Students
61,375 Students
% Black Students
36%
19%
# White Students
19,428 Students
191,076 Students
% White Students
24%
61%
# Hawaiian Students
90 Students
301 Students
% Hawaiian Students
n/a
n/a
# Two or more races Students
2,815 Students
13,437 Students
% of Two or more races Students
4%
4%
Students by Grade:
# Students in PK Grade:
3,134
4,463
# Students in K Grade:
6,391
8,748
# Students in 1st Grade:
6,524
9,053
# Students in 2nd Grade:
6,586
9,015
# Students in 3rd Grade:
6,086
8,869
# Students in 4th Grade:
6,011
9,837
# Students in 5th Grade:
5,914
18,109
# Students in 6th Grade:
5,466
70,329
# Students in 7th Grade:
5,533
74,290
# Students in 8th Grade:
5,528
74,350
# Students in 9th Grade:
5,793
8,695
# Students in 10th Grade:
6,340
6,911
# Students in 11th Grade:
5,980
6,404
# Students in 12th Grade:
5,602
6,470
# Ungraded Students:
-
-
District Revenue and Spending
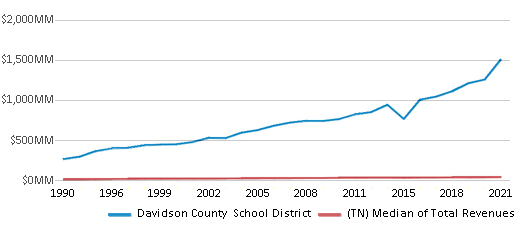
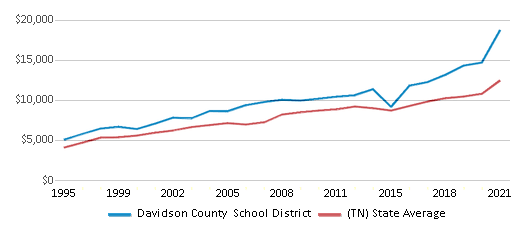
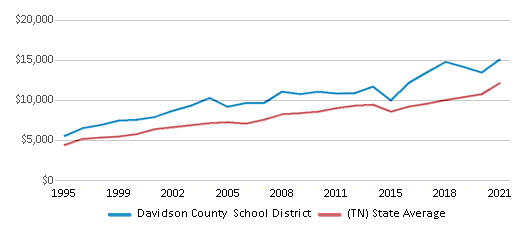
The revenue/student of $18,651 is higher than the state median of $11,979. The school district revenue/student has stayed relatively flat over four school years.
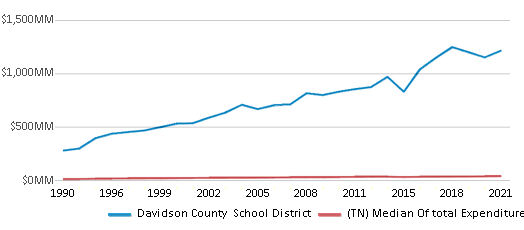
The school district's spending/student of $15,024 is higher than the state median of $11,478. The school district spending/student has stayed relatively flat over four school years.
Total Revenue
$1,509 MM
$12,104 MM
Spending
$1,215 MM
$11,597 MM
Revenue / Student
$18,651
$11,979
Spending / Student
$15,024
$11,478
Best Davidson County School District Public Middle Schools (2025)
School
(Math and Reading Proficiency)
(Math and Reading Proficiency)
Location
Grades
Students
Rank: #11.
Meigs Middle School
Magnet School
(Math: 85% | Reading: 87%)
Rank:
Rank:
10/
Top 1%10
713 Ramsey St
Nashville, TN 37206
(615) 271-3222
Nashville, TN 37206
(615) 271-3222
Grades: 5-8
| 693 students
Rank: #22.
Martin Luther King Jr School
Magnet School
(Math: 71% | Reading: 87%)
Rank:
Rank:
10/
Top 5%10
613 17th Avenue North
Nashville, TN 37203
(615) 329-8400
Nashville, TN 37203
(615) 329-8400
Grades: 7-12
| 1,219 students
Rank: #33.
Valor Voyager Academy
Charter School
(Math: 64% | Reading: 55%)
Rank:
Rank:
10/
Top 10%10
4531 Nolensville Pike, Suite 1
Nashville, TN 37211
(615) 823-7982
Nashville, TN 37211
(615) 823-7982
Grades: 5-8
| 513 students
Rank: #44.
Valor Flagship Academy
Charter School
(Math: 53% | Reading: 60%)
Rank:
Rank:
10/
Top 10%10
4527 Nollensville Rd
Nashville, TN 37211
(615) 823-7982
Nashville, TN 37211
(615) 823-7982
Grades: 5-12
| 1,403 students
Rank: #55.
Nashville Classical East
Charter School
(Math: 52% | Reading: 48%)
Rank:
Rank:
9/
Top 20%10
2000 Greenwood Ave
Nashville, TN 37206
(615) 538-5841
Nashville, TN 37206
(615) 538-5841
Grades: K-8
| 537 students
Rank: #66.
John Trotwood Moore Middle School
Magnet School
(Math: 49% | Reading: 51%)
Rank:
Rank:
9/
Top 20%10
4425 Granny White Pike
Nashville, TN 37204
(615) 298-8095
Nashville, TN 37204
(615) 298-8095
Grades: 6-8
| 409 students
Rank: #77.
Head Middle School
Magnet School
(Math: 41% | Reading: 52%)
Rank:
Rank:
9/
Top 20%10
1830 Jo Johnston Ave
Nashville, TN 37203
(615) 329-8160
Nashville, TN 37203
(615) 329-8160
Grades: 5-8
| 551 students
Rank: #88.
Rose Park Middle School
Magnet School
(Math: 38% | Reading: 45%)
Rank:
Rank:
8/
Top 30%10
1025 9th Avenue South
Nashville, TN 37203
(615) 291-6405
Nashville, TN 37203
(615) 291-6405
Grades: 5-8
| 387 students
Rank: #99.
West End Middle School
Magnet School
(Math: 35% | Reading: 44%)
Rank:
Rank:
8/
Top 30%10
3529 West End Ave
Nashville, TN 37205
(615) 298-8425
Nashville, TN 37205
(615) 298-8425
Grades: 6-8
| 332 students
Rank: #1010.
Harris-hillman Special Education
Special Education School
(Math: <50% | Reading: ≤20%)
Rank:
Rank:
6/
Top 50%10
1706 26th Avenue South
Nashville, TN 37212
(615) 298-8085
Nashville, TN 37212
(615) 298-8085
Grades: PK-12
| 486 students
Rank: #1111.
Liberty Collegiate Academy
Charter School
(Math: 38% | Reading: 26%)
Rank:
Rank:
5/
Bottom 50%10
3515 Gallatin Rd
Nashville, TN 37206
(615) 564-1974
Nashville, TN 37206
(615) 564-1974
Grades: 5-8
| 267 students
Rank: #1212.
East End Preparatory School
Charter School
(Math: 24% | Reading: 30%)
Rank:
Rank:
4/
Bottom 50%10
1460 Mcgavock Pike
Nashville, TN 37216
(615) 630-7470
Nashville, TN 37216
(615) 630-7470
Grades: K-8
| 756 students
Rank: #1313.
Nashville Prep
Charter School
(Math: 31% | Reading: 23%)
Rank:
Rank:
4/
Bottom 50%10
1300 56th Ave N
Nashville, TN 37209
(615) 921-8440
Nashville, TN 37209
(615) 921-8440
Grades: 5-8
| 211 students
Rank: #1414.
Bellevue Middle School
Magnet School
(Math: 26% | Reading: 26%)
Rank:
Rank:
4/
Bottom 50%10
655 Colice Jeanne Rd
Nashville, TN 37221
(615) 662-3000
Nashville, TN 37221
(615) 662-3000
Grades: 6-8
| 382 students
Rank: #1515.
Explore Community School
Charter School
(Math: 18% | Reading: 30%)
Rank:
Rank:
4/
Bottom 50%10
707 S 7th St
Nashville, TN 37206
(615) 784-8222
Nashville, TN 37206
(615) 784-8222
Grades: K-8
| 560 students
Rank: #1616.
Kipp Nashville College Prep
Charter School
(Math: 20% | Reading: 28%)
Rank:
Rank:
4/
Bottom 50%10
3410 Knight Dr
Nashville, TN 37207
(615) 226-4484
Nashville, TN 37207
(615) 226-4484
Grades: 5-8
| 348 students
Rank: #1717.
William Henry Oliver Middle School
(Math: 23% | Reading: 26%)
Rank:
Rank:
4/
Bottom 50%10
6211 Nolensville Rd
Nashville, TN 37211
(615) 332-3011
Nashville, TN 37211
(615) 332-3011
Grades: 5-8
| 614 students
Rank: #1818.
Isaac Litton Middle School
(Math: 20% | Reading: 27%)
Rank:
Rank:
4/
Bottom 50%10
4601 Hedgewood Dr
Nashville, TN 37216
(615) 262-6700
Nashville, TN 37216
(615) 262-6700
Grades: 6-8
| 286 students
Rank: #1919.
Kipp Academy Nashville
Charter School
(Math: 22% | Reading: 25%)
Rank:
Rank:
4/
Bottom 50%10
123 Douglas Ave
Nashville, TN 37207
(615) 514-6266
Nashville, TN 37207
(615) 514-6266
Grades: 5-8
| 391 students
Rank: #2020.
Strive Collegiate Academy
Charter School
(Math: 11% | Reading: 27%)
Rank:
Rank:
3/
Bottom 50%10
3055 Lebanon Pike, Suite 300
Nashville, TN 37214
(615) 645-6440
Nashville, TN 37214
(615) 645-6440
Grades: 6-8
| 229 students
Rank: #2121.
H. G. Hill Middle School
(Math: 18% | Reading: 21%)
Rank:
Rank:
3/
Bottom 50%10
150 Davidson Rd
Nashville, TN 37205
(615) 353-2020
Nashville, TN 37205
(615) 353-2020
Grades: 6-8
| 433 students
Rank: #2222.
Stem Prep Academy
Charter School
(Math: 16% | Reading: 23%)
Rank:
Rank:
3/
Bottom 50%10
1162 Foster Ave
Nashville, TN 37210
(615) 752-0002
Nashville, TN 37210
(615) 752-0002
Grades: 5-8
| 506 students
Rank: #2323.
Murrell At Glenn School
Special Education School
(Math: ≤20% | Reading: ≤20%)
Rank:
Rank:
3/
Bottom 50%10
322 Cleveland St
Nashville, TN 37207
(615) 298-8070
Nashville, TN 37207
(615) 298-8070
Grades: K-8
| 34 students
Rank: #2424.
Lead Southeast
Charter School
(Math: 16% | Reading: 22%)
Rank:
Rank:
3/
Bottom 50%10
531 Metroplex Dr
Nashville, TN 37211
(615) 338-9672
Nashville, TN 37211
(615) 338-9672
Grades: 5-12
| 850 students
Rank: #2525.
Croft Middle School
Magnet School
(Math: 15% | Reading: 22%)
Rank:
Rank:
3/
Bottom 50%10
482 Elysian Fields Dr
Nashville, TN 37211
(615) 332-0217
Nashville, TN 37211
(615) 332-0217
Grades: 6-8
| 467 students
Rank: #2626.
Intrepid College Preparatory Charter School
Charter School
(Math: 14% | Reading: 23%)
Rank:
Rank:
3/
Bottom 50%10
5432 Bell Forge Lane East
Antioch, TN 37013
(615) 200-0131
Antioch, TN 37013
(615) 200-0131
Grades: 5-12
| 855 students
Rank: #2727.
Dupont Hadley Middle School
(Math: 13% | Reading: 23%)
Rank:
Rank:
3/
Bottom 50%10
1901 Old Hickory Blvd
Old Hickory, TN 37138
(615) 847-7300
Old Hickory, TN 37138
(615) 847-7300
Grades: 6-8
| 379 students
Rank: #2828.
Mnps Virtual School
(Math: 6-9% | Reading: 25-29%)
Rank:
Rank:
3/
Bottom 50%10
4805 Park Ave, Suite 300
Nashville, TN 37209
(615) 463-0188
Nashville, TN 37209
(615) 463-0188
Grades: 4-12
| 152 students
Rank: #2929.
John F. Kennedy Middle School
(Math: 12% | Reading: 13%)
Rank:
Rank:
2/
Bottom 50%10
2087 Hobson Pike
Antioch, TN 37013
(615) 501-7900
Antioch, TN 37013
(615) 501-7900
Grades: 5-8
| 907 students
Rank: #3030.
Lead Cameron
Charter School
(Math: 12% | Reading: 12%)
Rank:
Rank:
2/
Bottom 50%10
1034 1st Avenue South
Nashville, TN 37210
(615) 291-6365
Nashville, TN 37210
(615) 291-6365
Grades: 5-8
| 496 students
Rank: #3131.
Cora Howe School
Special Education School
(Math: 11-19% | Reading: ≤10%)
Rank:
Rank:
2/
Bottom 50%10
1928 Greenwood Ave
Nashville, TN 37206
(615) 612-2545
Nashville, TN 37206
(615) 612-2545
Grades: K-12
| 77 students
Rank: #3232.
Donelson Middle School
(Math: 10% | Reading: 15%)
Rank:
Rank:
2/
Bottom 50%10
110 Stewarts Ferry Pike
Nashville, TN 37214
(615) 884-4080
Nashville, TN 37214
(615) 884-4080
Grades: 6-8
| 430 students
Rank: #3333.
Thurgood Marshall Middle School
(Math: 11% | Reading: 14%)
Rank:
Rank:
2/
Bottom 50%10
5820 Pettus Rd
Antioch, TN 37013
(615) 941-7515
Antioch, TN 37013
(615) 941-7515
Grades: 5-8
| 761 students
Rank: #34 - 3534. - 35.
Ka @ The Crossings
Charter School
(Math: 6-9% | Reading: 15-19%)
Rank:
Rank:
2/
Bottom 50%10
5320 Hickory Hollow Pkwy
Antioch, TN 37013
(615) 810-8370
Antioch, TN 37013
(615) 810-8370
Grades: 5-8
| 104 students
Rank: #34 - 3534. - 35.
Knowledge Academy
Charter School
(Math: 6-9% | Reading: 15-19%)
Rank:
Rank:
2/
Bottom 50%10
5320 Hickory Hollow Pkwy
Antioch, TN 37013
(615) 800-6814
Antioch, TN 37013
(615) 800-6814
Grades: 5-8
| 126 students
Show 19 more public schools in Davidson County School District (out of 54 total schools)
Loading...
Recent Articles

Year-Round Or Traditional Schedule?
Which is more appropriate for your child? A year-round attendance schedule or traditional schedule? We look at the pros and cons.

Why You Should Encourage Your Child to Join a Sports Team
Participating in team sports has a great many benefits for children, there is no doubt. In this article you will learn what those benefits are.

White Students are Now the Minority in U.S. Public Schools
Increasing birth rates among immigrant families from Asia and Central and South America, combined with lower birth rates among white families, means that for the first time in history, public school students in the United States are majority-minority. This shift in demographics poses difficulties for schools as they work to accommodate children of varying language abilities and socio-economic backgrounds.


