Top Rankings
Memphis-Shelby County Schools School District ranks among the top 20% of public school district in Tennessee for:
Category
Attribute
Community Size
Largest student body (number of students) (Top 1%)
For the 2025 school year, there are 225 public schools serving 111,219 students in Memphis-Shelby County Schools School District. This district's average testing ranking is 1/10, which is in the bottom 50% of public schools in Tennessee.
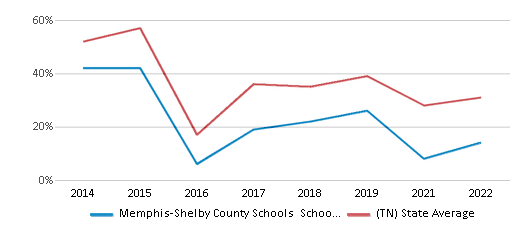
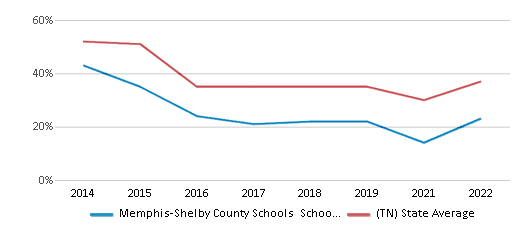
Public Schools in Memphis-Shelby County Schools School District have an average math proficiency score of 14% (versus the Tennessee public school average of 31%), and reading proficiency score of 23% (versus the 37% statewide average).
Minority enrollment is 95% of the student body (majority Black), which is more than the Tennessee public school average of 43% (majority Black).
Overview
This School District
This State (TN)
# Schools
225 Schools
1,925 Schools
# Students
111,219 Students
1,010,424 Students
# Teachers
6,868 Teachers
66,546 Teachers
Student : Teacher Ratio
16:1
16:1
District Rank
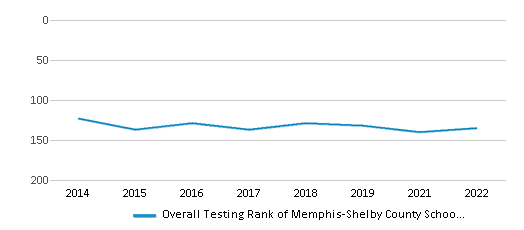
Memphis-Shelby County Schools School District, which is ranked within the bottom 50% of all 147 school districts in Tennessee (based off of combined math and reading proficiency testing data) for the 2021-2022 school year.
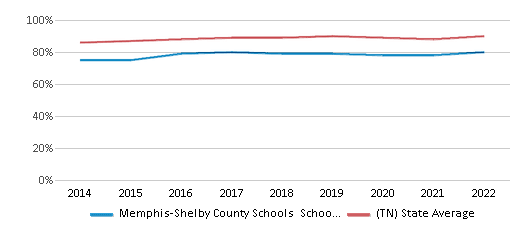
The school district's graduation rate of 80% has stayed relatively flat over five school years.
Overall District Rank
#135 out of 147 school districts
(Bottom 50%)
(Bottom 50%)
Math Test Scores (% Proficient)
14%
31%
Reading/Language Arts Test Scores (% Proficient)
23%
37%
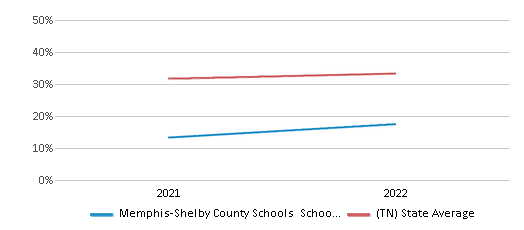
Science Test Scores (% Proficient)
21%
40%
Graduation Rate
80%
90%
Students by Ethnicity:
Diversity Score
0.45
0.61
# American Indian Students
91 Students
1,743 Students
% American Indian Students
n/a
n/a
# Asian Students
903 Students
21,159 Students
% Asian Students
1%
2%
# Hispanic Students
20,991 Students
149,418 Students
% Hispanic Students
19%
15%
# Black Students
79,969 Students
209,194 Students
% Black Students
72%
21%
# White Students
5,800 Students
580,750 Students
% White Students
5%
57%
# Hawaiian Students
44 Students
1,186 Students
% Hawaiian Students
n/a
n/a
# Two or more races Students
3,421 Students
46,971 Students
% of Two or more races Students
3%
5%
Students by Grade:
# Students in PK Grade:
4,874
33,223
# Students in K Grade:
8,830
74,731
# Students in 1st Grade:
8,809
76,014
# Students in 2nd Grade:
9,133
77,971
# Students in 3rd Grade:
8,352
74,743
# Students in 4th Grade:
8,448
75,052
# Students in 5th Grade:
8,699
75,941
# Students in 6th Grade:
8,196
75,064
# Students in 7th Grade:
8,022
74,290
# Students in 8th Grade:
7,785
74,350
# Students in 9th Grade:
8,476
77,036
# Students in 10th Grade:
7,482
77,259
# Students in 11th Grade:
6,895
73,989
# Students in 12th Grade:
7,218
70,761
# Ungraded Students:
-
-
District Revenue and Spending
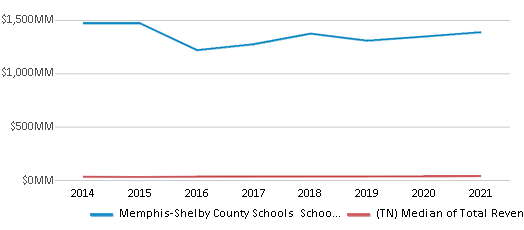
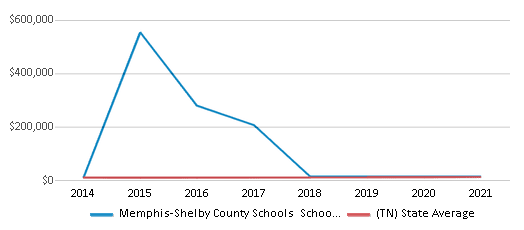
The revenue/student of $12,462 is higher than the state median of $11,979. The school district revenue/student has stayed relatively flat over four school years.
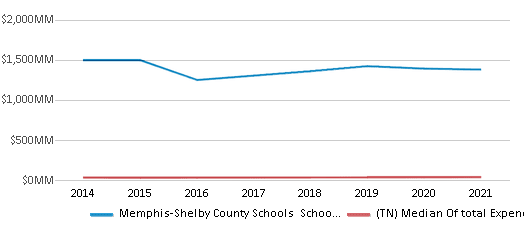
The school district's spending/student of $12,433 is higher than the state median of $11,478. The school district spending/student has stayed relatively flat over four school years.
Total Revenue
$1,386 MM
$12,104 MM
Spending
$1,383 MM
$11,597 MM
Revenue / Student
$12,462
$11,979
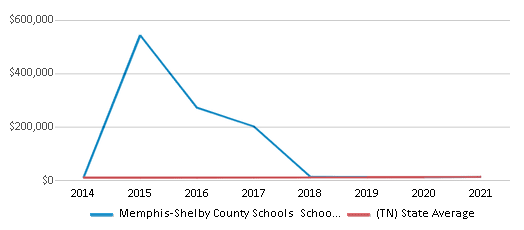
Spending / Student
$12,433
$11,478
Best Memphis-Shelby County Schools School District Public Schools (2025)
School
(Math and Reading Proficiency)
(Math and Reading Proficiency)
Location
Grades
Students
Rank: #11.
Campus School
(Math: 75-79% | Reading: 85-89%)
Rank:
Rank:
10/
Top 5%10
535 Zach Curlin
Memphis, TN 38152
(901) 678-2285
Memphis, TN 38152
(901) 678-2285
Grades: K-5
| 407 students
Rank: #22.
Maxine Smith Steam Academy
(Math: 60% | Reading: 79%)
Rank:
Rank:
10/
Top 5%10
750 E Parkway S
Memphis, TN 38104
(901) 416-4536
Memphis, TN 38104
(901) 416-4536
Grades: 6-8
| 397 students
Rank: #33.
Richland Elementary School
(Math: 67% | Reading: 58%)
Rank:
Rank:
10/
Top 10%10
5440 Rich Rd
Memphis, TN 38120
(901) 416-2148
Memphis, TN 38120
(901) 416-2148
Grades: PK-5
| 911 students
Rank: #44.
White Station Middle School
Magnet School
(Math: 52% | Reading: 58%)
Rank:
Rank:
10/
Top 10%10
5465 Mason Rd
Memphis, TN 38120
(901) 416-2184
Memphis, TN 38120
(901) 416-2184
Grades: 6-8
| 1,091 students
Rank: #55.
J. P. Freeman Elementary Middle School
Magnet School
(Math: 53% | Reading: 55%)
Rank:
Rank:
9/
Top 20%10
5250 Tulane Rd
Memphis, TN 38109
(901) 416-3156
Memphis, TN 38109
(901) 416-3156
Grades: K-8
| 493 students
Rank: #66.
Idlewild Elementary School
Magnet School
(Math: 48% | Reading: 63%)
Rank:
Rank:
9/
Top 20%10
1950 Linden Ave
Memphis, TN 38104
(901) 416-4566
Memphis, TN 38104
(901) 416-4566
Grades: K-5
| 588 students
Rank: #77.
Shrine School
Special Education School
(Math: <50% | Reading: <50%)
Rank:
Rank:
9/
Top 20%10
4259 Forest View Dr
Memphis, TN 38118
(901) 416-2400
Memphis, TN 38118
(901) 416-2400
Grades: PK-12
| 136 students
Rank: #88.
White Station Elementary School
(Math: 44% | Reading: 57%)
Rank:
Rank:
9/
Top 20%10
4840 Chickasaw Rd
Memphis, TN 38117
(901) 416-8900
Memphis, TN 38117
(901) 416-8900
Grades: PK-5
| 795 students
Rank: #99.
East High School
Magnet School
(Math: 39% | Reading: 69%)
Rank:
Rank:
9/
Top 20%10
3206 Poplar Ave
Memphis, TN 38111
(901) 416-6160
Memphis, TN 38111
(901) 416-6160
Grades: 9-12
| 615 students
Rank: #1010.
White Station High School
Magnet School
(Math: 40% | Reading: 62%)
Rank:
Rank:
9/
Top 20%10
514 S Perkins Rd
Memphis, TN 38117
(901) 416-8880
Memphis, TN 38117
(901) 416-8880
Grades: 9-12
| 1,935 students
Rank: #1111.
Delano Elementary School
Magnet School
(Math: 40-44% | Reading: 50-54%)
Rank:
Rank:
9/
Top 20%10
1716 Delano Ave
Memphis, TN 38127
(901) 416-3932
Memphis, TN 38127
(901) 416-3932
Grades: PK-5
| 315 students
Rank: #1212.
Grahamwood Elementary School
Magnet School
(Math: 39% | Reading: 47%)
Rank:
Rank:
8/
Top 30%10
3950 Summer Ave
Memphis, TN 38122
(901) 416-5952
Memphis, TN 38122
(901) 416-5952
Grades: PK-5
| 887 students
Rank: #1313.
E.e. Jeter Elementary Middle School
(Math: 41% | Reading: 44%)
Rank:
Rank:
8/
Top 30%10
7662 Benjestown Rd
Millington, TN 38053
(901) 416-2955
Millington, TN 38053
(901) 416-2955
Grades: PK-8
| 369 students
Rank: #1414.
University Middle School
(Math: 32% | Reading: 54%)
Rank:
Rank:
8/
Top 30%10
330 Innovation Dr
Memphis, TN 38111
(901) 678-2285
Memphis, TN 38111
(901) 678-2285
Grades: 6-8
| 268 students
Rank: #1515.
Middle College High School
(Math: 29% | Reading: 60-64%)
Rank:
Rank:
8/
Top 30%10
750 E Parkway S
Memphis, TN 38104
(901) 416-4550
Memphis, TN 38104
(901) 416-4550
Grades: 9-12
| 333 students
Rank: #1616.
Riverwood Elementary School
Magnet School
(Math: 36% | Reading: 44%)
Rank:
Rank:
8/
Top 30%10
1330 Stern Ln
Cordova, TN 38016
(901) 416-2310
Cordova, TN 38016
(901) 416-2310
Grades: PK-5
| 1,018 students
Rank: #1717.
Southwind Elementary School
(Math: 38% | Reading: 38%)
Rank:
Rank:
7/
Top 50%10
8155 Meadow Vale Dr
Memphis, TN 38125
(901) 416-2805
Memphis, TN 38125
(901) 416-2805
Grades: PK-5
| 661 students
Rank: #1818.
Medical District High School
(Math: 20-24% | Reading: 60-64%)
Rank:
Rank:
7/
Top 50%10
737 Union Ave
Memphis, TN 38103
(901) 416-9698
Memphis, TN 38103
(901) 416-9698
Grades: 9-12
| 111 students
Rank: #1919.
Springdale Elementary School
Magnet School
(Math: 55-59% | Reading: 20-24%)
Rank:
Rank:
6/
Top 50%10
880 N Hollywood St
Memphis, TN 38108
(901) 416-4883
Memphis, TN 38108
(901) 416-4883
Grades: PK-5
| 226 students
Rank: #2020.
Macon-hall Elementary School
(Math: 33% | Reading: 35%)
Rank:
Rank:
6/
Top 50%10
9800 Macon Rd
Cordova, TN 38016
(901) 416-2625
Cordova, TN 38016
(901) 416-2625
Grades: PK-5
| 1,166 students
Rank: #2121.
Germantown Elementary School
(Math: 27% | Reading: 37%)
Rank:
Rank:
6/
Top 50%10
2730 Cross Country Dr
Germantown, TN 38138
(901) 416-0945
Germantown, TN 38138
(901) 416-0945
Grades: PK-5
| 558 students
Rank: #2222.
Crosstown High School
Charter School
(Math: 17% | Reading: 47%)
Rank:
Rank:
6/
Top 50%10
1365 Tower Ave
Memphis, TN 38104
(901) 401-5505
Memphis, TN 38104
(901) 401-5505
Grades: 9-12
| 499 students
Rank: #2323.
Memphis Stem Academy
Charter School
(Math: 30-34% | Reading: 30-34%)
Rank:
Rank:
6/
Top 50%10
2180 Frayser Blvd
Memphis, TN 38127
(901) 708-3001
Memphis, TN 38127
(901) 708-3001
Grades: PK-5
| 243 students
Rank: #2424.
Oak Forest Elementary School
Magnet School
(Math: 20-24% | Reading: 35-39%)
Rank:
Rank:
6/
Top 50%10
7440 Nonconnah View Cv
Memphis, TN 38119
(901) 416-2257
Memphis, TN 38119
(901) 416-2257
Grades: PK-5
| 418 students
Rank: #2525.
Hollis F. Price Middle College
(Math: ≤10% | Reading: 50-59%)
Rank:
Rank:
5/
Bottom 50%10
807 Walker Ave
Memphis, TN 38126
(901) 435-1765
Memphis, TN 38126
(901) 435-1765
Grades: 9-12
| 105 students
Rank: #2626.
Sea Isle Elementary School
(Math: 25-29% | Reading: 30-34%)
Rank:
Rank:
5/
Bottom 50%10
5250 Sea Isle Rd
Memphis, TN 38117
(901) 416-2104
Memphis, TN 38117
(901) 416-2104
Grades: PK-5
| 499 students
Rank: #2727.
Memphis Business Academy Hickory Hill Elementary School
Charter School
(Math: 21-39% | Reading: 21-39%)
Rank:
Rank:
5/
Bottom 50%10
4443 S. Germantown Rd
Memphis, TN 38125
(901) 505-0551
Memphis, TN 38125
(901) 505-0551
Grades: PK-5
| 174 students
Rank: #2828.
Balmoral/ridgeway Elementary School
Magnet School
(Math: 15-19% | Reading: 35-39%)
Rank:
Rank:
5/
Bottom 50%10
5905 Grosvenor Ave
Memphis, TN 38119
(901) 416-2128
Memphis, TN 38119
(901) 416-2128
Grades: K-5
| 271 students
Rank: #2929.
Hickory Ridge Elementary School
(Math: 26% | Reading: 32%)
Rank:
Rank:
5/
Bottom 50%10
3890 Hickory Hill Rd
Memphis, TN 38115
(901) 416-1195
Memphis, TN 38115
(901) 416-1195
Grades: PK-5
| 616 students
Rank: #3030.
Memphis Rise Academy
Charter School
(Math: 30% | Reading: 29%)
Rank:
Rank:
5/
Bottom 50%10
5221 Raleigh Lagrange Rd
Memphis, TN 38122
(901) 379-5750
Memphis, TN 38122
(901) 379-5750
Grades: 6-12
| 755 students
Rank: #3131.
Chimneyrock Elementary School
(Math: 25% | Reading: 32%)
Rank:
Rank:
5/
Bottom 50%10
8601 Chimneyrock Blvd
Cordova, TN 38016
(901) 416-2067
Cordova, TN 38016
(901) 416-2067
Grades: PK-5
| 931 students
Rank: #3232.
Germanshire Elementary School
(Math: 28% | Reading: 29%)
Rank:
Rank:
5/
Bottom 50%10
3965 South Germantown Rd
Memphis, TN 38125
(901) 416-3733
Memphis, TN 38125
(901) 416-3733
Grades: PK-5
| 751 students
Rank: #3333.
Kate Bond Elementary School
(Math: 26% | Reading: 29%)
Rank:
Rank:
4/
Bottom 50%10
2727 Kate Bond Rd
Memphis, TN 38133
(901) 416-0020
Memphis, TN 38133
(901) 416-0020
Grades: PK-5
| 787 students
Rank: #3434.
Germantown Middle School
(Math: 17% | Reading: 34%)
Rank:
Rank:
4/
Bottom 50%10
7925 Cd Smith Rd
Germantown, TN 38138
(901) 416-0950
Germantown, TN 38138
(901) 416-0950
Grades: 6-8
| 637 students
Rank: #35 - 3735. - 37.
Fox Meadows Elementary School
(Math: 15-19% | Reading: 30-34%)
Rank:
Rank:
4/
Bottom 50%10
2960 Emerald St
Memphis, TN 38115
(901) 416-2530
Memphis, TN 38115
(901) 416-2530
Grades: PK-5
| 536 students
Show 100 more public schools in Memphis-Shelby County Schools School District (out of 225 total schools)
Loading...
Frequently Asked Questions
How many schools belong to Memphis-Shelby County Schools School District?
Memphis-Shelby County Schools School District manages 225 public schools serving 111,219 students.
What is the rank of Memphis-Shelby County Schools School District?
Memphis-Shelby County Schools School District is ranked #135 out of 147 school districts in Tennessee (bottom 50%) based off of combined math and reading proficiency testing data for the 2021-2022 school year. This district ranks in the top 20% of Tennessee school districts for: Largest student body (number of students) (Top 1%)
What is the racial composition of students in Memphis-Shelby County Schools School District?
72% of Memphis-Shelby County Schools School District students are Black, 19% of students are Hispanic, 5% of students are White, 3% of students are Two or more races, and 1% of students are Asian.
What is the student/teacher ratio of Memphis-Shelby County Schools School District?
Memphis-Shelby County Schools School District has a student/teacher ratio of 16:1, which is higher than the Tennessee state average of 15:1.
What is Memphis-Shelby County Schools School District's spending/student ratio?
The school district's spending/student of $12,433 is higher than the state median of $11,478. The school district spending/student has stayed relatively flat over four school years.
Recent Articles

Year-Round Or Traditional Schedule?
Which is more appropriate for your child? A year-round attendance schedule or traditional schedule? We look at the pros and cons.

Why You Should Encourage Your Child to Join a Sports Team
Participating in team sports has a great many benefits for children, there is no doubt. In this article you will learn what those benefits are.

White Students are Now the Minority in U.S. Public Schools
Increasing birth rates among immigrant families from Asia and Central and South America, combined with lower birth rates among white families, means that for the first time in history, public school students in the United States are majority-minority. This shift in demographics poses difficulties for schools as they work to accommodate children of varying language abilities and socio-economic backgrounds.


