Top Rankings
Montgomery County School District ranks among the top 20% of public school district in Tennessee for:
Category
Attribute
Science Proficiency
Highest science proficiency (Top 20%)
Diversity
Most diverse schools (Top 1%)
Community Size
Largest student body (number of students) (Top 1%)
For the 2025 school year, there are 34 public elementary schools serving 28,146 students in Montgomery County School District. This district's average elementary testing ranking is 7/10, which is in the top 50% of public elementary schools in Tennessee.
Public Elementary Schools in Montgomery County School District have an average math proficiency score of 36% (versus the Tennessee public elementary school average of 35%), and reading proficiency score of 37% (versus the 36% statewide average).
Minority enrollment is 54% of the student body (majority Black), which is more than the Tennessee public elementary school average of 43% (majority Black).
Overview
This School District
This State (TN)
# Schools
44 Schools
1,500 Schools
# Students
39,345 Students
719,413 Students
# Teachers
2,179 Teachers
48,388 Teachers
Student : Teacher Ratio
18:1
18:1
District Rank
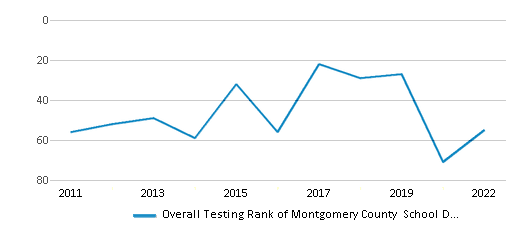
Montgomery County School District, which is ranked within the top 50% of all 147 school districts in Tennessee (based off of combined math and reading proficiency testing data) for the 2021-2022 school year.
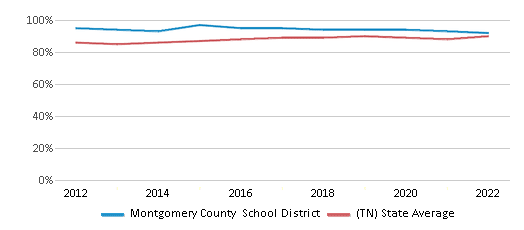
The school district's graduation rate of 92% has decreased from 95% over five school years.
Overall District Rank
#55 out of 147 school districts
(Top 50%)
(Top 50%)
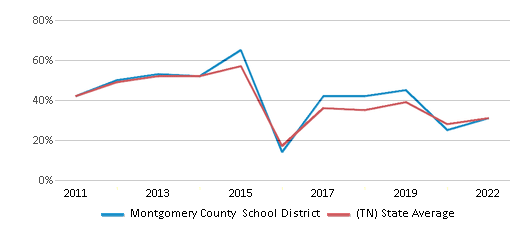
Math Test Scores (% Proficient)
31%
31%
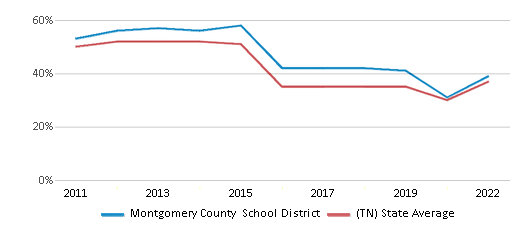
Reading/Language Arts Test Scores (% Proficient)
39%
37%
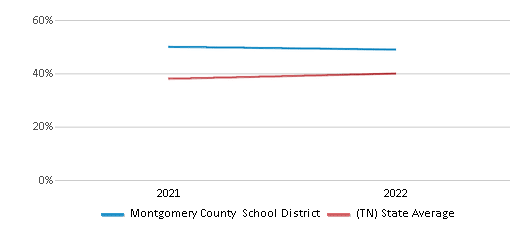
Science Test Scores (% Proficient)
49%
40%
Graduation Rate
92%
90%
Students by Ethnicity:
Diversity Score
0.70
0.61
# American Indian Students
121 Students
1,225 Students
% American Indian Students
n/a
n/a
# Asian Students
735 Students
15,029 Students
% Asian Students
2%
2%
# Hispanic Students
6,543 Students
106,507 Students
% Hispanic Students
17%
15%
# Black Students
9,909 Students
149,772 Students
% Black Students
25%
21%
# White Students
17,794 Students
410,765 Students
% White Students
45%
57%
# Hawaiian Students
245 Students
856 Students
% Hawaiian Students
1%
n/a
# Two or more races Students
3,998 Students
35,256 Students
% of Two or more races Students
10%
5%
Students by Grade:
# Students in PK Grade:
704
29,574
# Students in K Grade:
3,014
74,511
# Students in 1st Grade:
3,080
76,014
# Students in 2nd Grade:
3,152
77,971
# Students in 3rd Grade:
2,994
74,743
# Students in 4th Grade:
3,109
75,052
# Students in 5th Grade:
2,957
75,941
# Students in 6th Grade:
3,004
75,064
# Students in 7th Grade:
2,888
70,062
# Students in 8th Grade:
2,933
69,763
# Students in 9th Grade:
3,193
5,469
# Students in 10th Grade:
2,950
5,392
# Students in 11th Grade:
2,619
4,910
# Students in 12th Grade:
2,748
4,947
# Ungraded Students:
-
-
District Revenue and Spending
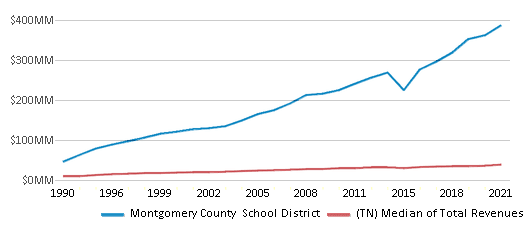
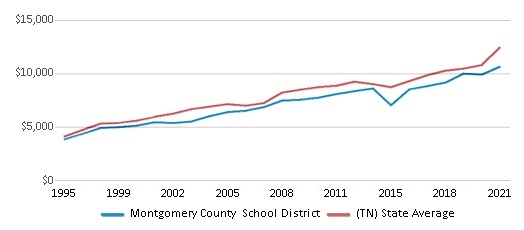
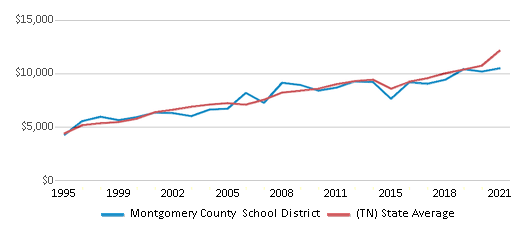
The revenue/student of $9,838 in this school district is less than the state median of $11,979. The school district revenue/student has declined by 7% over four school years.
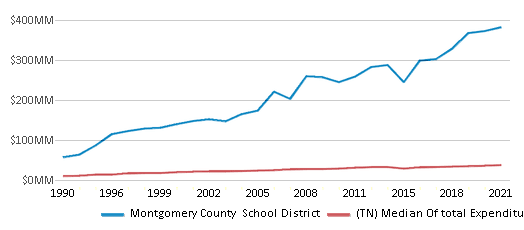
The school district's spending/student of $9,702 is less than the state median of $11,478. The school district spending/student has declined by 7% over four school years.
Total Revenue
$387 MM
$12,104 MM
Spending
$382 MM
$11,597 MM
Revenue / Student
$9,838
$11,979
Spending / Student
$9,702
$11,478
Best Montgomery County School District Public Elementary Schools (2025)
School
(Math and Reading Proficiency)
(Math and Reading Proficiency)
Location
Grades
Students
Rank: #11.
Spanish Immersion Barksdale
(Math: 80-89% | Reading: 70-79%)
Rank:
Rank:
10/
Top 5%10
1920 Madison St, C/o Spanish I
Clarksville, TN 37043
(931) 648-5685
Clarksville, TN 37043
(931) 648-5685
Grades: K-5
| 270 students
Rank: #22.
Rossview Elementary School
(Math: 73% | Reading: 65%)
Rank:
Rank:
10/
Top 5%10
2235 Cardinal Ln
Clarksville, TN 37043
(931) 645-1403
Clarksville, TN 37043
(931) 645-1403
Grades: PK-5
| 1,231 students
Rank: #33.
Sango Elementary School
(Math: 68% | Reading: 67%)
Rank:
Rank:
10/
Top 5%10
3585 Sango Rd
Clarksville, TN 37043
(931) 358-4093
Clarksville, TN 37043
(931) 358-4093
Grades: K-5
| 930 students
Rank: #44.
East Montgomery Elementary School
(Math: 69% | Reading: 56%)
Rank:
Rank:
10/
Top 10%10
230 Mcadoo Creek Rd
Clarksville, TN 37043
(931) 358-2868
Clarksville, TN 37043
(931) 358-2868
Grades: PK-5
| 748 students
Rank: #55.
Carmel Elementary School
(Math: 59% | Reading: 60%)
Rank:
Rank:
10/
Top 10%10
4925 Sango Rd
Clarksville, TN 37043
(931) 802-5025
Clarksville, TN 37043
(931) 802-5025
Grades: PK-5
| 630 students
Rank: #66.
Montgomery Central Elementary School
(Math: 52% | Reading: 57%)
Rank:
Rank:
10/
Top 10%10
4011 Highway 48
Cunningham, TN 37052
(931) 387-3208
Cunningham, TN 37052
(931) 387-3208
Grades: PK-5
| 477 students
Rank: #77.
Woodlawn Elementary School
(Math: 56% | Reading: 50%)
Rank:
Rank:
9/
Top 20%10
2250 Woodlawn Rd
Woodlawn, TN 37191
(931) 648-5680
Woodlawn, TN 37191
(931) 648-5680
Grades: PK-5
| 732 students
Rank: #88.
Barksdale Elementary School
(Math: 47% | Reading: 50%)
Rank:
Rank:
9/
Top 20%10
1920 Madison St
Clarksville, TN 37043
(931) 648-5685
Clarksville, TN 37043
(931) 648-5685
Grades: PK-5
| 487 students
Rank: #99.
Cumberland Heights Elementary School
(Math: 49% | Reading: 42%)
Rank:
Rank:
9/
Top 20%10
2093 Ussery Rd S
Clarksville, TN 37040
(931) 648-5695
Clarksville, TN 37040
(931) 648-5695
Grades: PK-5
| 610 students
Rank: #1010.
Rossview Middle School
(Math: 44% | Reading: 43%)
Rank:
Rank:
8/
Top 30%10
2265 Cardinal Ln
Clarksville, TN 37043
(931) 920-6150
Clarksville, TN 37043
(931) 920-6150
Grades: 6-8
| 1,059 students
Rank: #1111.
Northeast Elementary School
(Math: 40% | Reading: 42%)
Rank:
Rank:
8/
Top 30%10
3705 Trenton Rd
Clarksville, TN 37040
(931) 648-5662
Clarksville, TN 37040
(931) 648-5662
Grades: PK-5
| 867 students
Rank: #1212.
Richview Middle School
(Math: 44% | Reading: 37%)
Rank:
Rank:
8/
Top 30%10
2350 Memorial Dr
Clarksville, TN 37043
(931) 648-5620
Clarksville, TN 37043
(931) 648-5620
Grades: 6-8
| 1,136 students
Rank: #1313.
Oakland Elementary School
(Math: 35% | Reading: 42%)
Rank:
Rank:
7/
Top 50%10
1050 Cherry Blossom Ln
Clarksville, TN 37040
(931) 920-7422
Clarksville, TN 37040
(931) 920-7422
Grades: PK-5
| 1,173 students
Rank: #1414.
West Creek Elementary School
(Math: 35% | Reading: 41%)
Rank:
Rank:
7/
Top 50%10
1201 W Creek Coyote Trl
Clarksville, TN 37042
(931) 802-8637
Clarksville, TN 37042
(931) 802-8637
Grades: PK-5
| 1,069 students
Rank: #1515.
Glenellen Elementary School
(Math: 36% | Reading: 39%)
Rank:
Rank:
7/
Top 50%10
825 Needmore Rd
Clarksville, TN 37040
(931) 920-6158
Clarksville, TN 37040
(931) 920-6158
Grades: PK-5
| 1,038 students
Rank: #1616.
Hazelwood Elementary School
(Math: 36% | Reading: 36%)
Rank:
Rank:
7/
Top 50%10
2623 Tiny Town Rd
Clarksville, TN 37042
(931) 553-2075
Clarksville, TN 37042
(931) 553-2075
Grades: PK-5
| 930 students
Rank: #1717.
Cmcss K-12 Virtual School
(Math: 25% | Reading: 44%)
Rank:
Rank:
6/
Top 50%10
1312 Highway 48
Clarksville, TN 37040
(931) 553-1117
Clarksville, TN 37040
(931) 553-1117
Grades: K-12
| 793 students
Rank: #1818.
Pisgah Elementary School
(Math: 33% | Reading: 36%)
Rank:
Rank:
6/
Top 50%10
1770 Hazelwood Rd
Clarksville, TN 37042
(931) 802-6790
Clarksville, TN 37042
(931) 802-6790
Grades: PK-5
| 1,064 students
Rank: #1919.
Montgomery Central Middle School
(Math: 35% | Reading: 34%)
Rank:
Rank:
6/
Top 50%10
3941 Highway 48
Cunningham, TN 37052
(931) 387-2575
Cunningham, TN 37052
(931) 387-2575
Grades: 6-8
| 808 students
Rank: #2020.
Barkers Mill Elementary School
(Math: 34% | Reading: 32%)
Rank:
Rank:
6/
Top 50%10
1230 Little Bobcat Ln
Clarksville, TN 37042
(931) 906-7235
Clarksville, TN 37042
(931) 906-7235
Grades: PK-5
| 988 students
Rank: #2121.
Moore Magnet Elementary School
Magnet School
(Math: 30% | Reading: 34%)
Rank:
Rank:
6/
Top 50%10
1350 Madison St
Clarksville, TN 37040
(931) 648-5635
Clarksville, TN 37040
(931) 648-5635
Grades: PK-5
| 517 students
Rank: #2222.
Liberty Elementary School
(Math: 28% | Reading: 34%)
Rank:
Rank:
6/
Top 50%10
849 S Liberty Church Rd
Clarksville, TN 37042
(931) 905-5729
Clarksville, TN 37042
(931) 905-5729
Grades: PK-5
| 769 students
Rank: #2323.
Byrns Darden Elementary School
(Math: 28% | Reading: 32%)
Rank:
Rank:
5/
Bottom 50%10
609 E St
Clarksville, TN 37042
(931) 648-5615
Clarksville, TN 37042
(931) 648-5615
Grades: PK-5
| 542 students
Rank: #2424.
West Creek Middle School
(Math: 32% | Reading: 29%)
Rank:
Rank:
5/
Bottom 50%10
1200 W Creek Coyote Trl
Clarksville, TN 37042
(931) 503-3288
Clarksville, TN 37042
(931) 503-3288
Grades: 6-8
| 1,162 students
Rank: #2525.
New Providence Middle School
(Math: 25% | Reading: 27%)
Rank:
Rank:
4/
Bottom 50%10
146 Cunningham Ln
Clarksville, TN 37042
(931) 648-5655
Clarksville, TN 37042
(931) 648-5655
Grades: 6-8
| 1,055 students
Rank: #2626.
St. Bethlehem Elementary School
(Math: 45-49% | Reading: 40-44% )
Rank:
Rank:
4/
Bottom 50%10
2450 Old Russellville Pike
Clarksville, TN 37040
(931) 648-5670
Clarksville, TN 37040
(931) 648-5670
Grades: PK-2
| 498 students
Rank: #2727.
Minglewood Elementary School
(Math: 27% | Reading: 25%)
Rank:
Rank:
4/
Bottom 50%10
215 Cunningham Ln
Clarksville, TN 37042
(931) 648-5646
Clarksville, TN 37042
(931) 648-5646
Grades: PK-5
| 757 students
Rank: #2828.
Ringgold Elementary School
(Math: 23% | Reading: 28%)
Rank:
Rank:
4/
Bottom 50%10
240 Ringgold Rd
Clarksville, TN 37042
(931) 648-5625
Clarksville, TN 37042
(931) 648-5625
Grades: PK-5
| 854 students
Rank: #2929.
Burt Elementary School
(Math: 25% | Reading: 26%)
Rank:
Rank:
4/
Bottom 50%10
110 Bailey St
Clarksville, TN 37040
(931) 648-5630
Clarksville, TN 37040
(931) 648-5630
Grades: 3-5
| 360 students
Rank: #3030.
Kenwood Elementary School
(Math: 25% | Reading: 25%)
Rank:
Rank:
4/
Bottom 50%10
1101 Peachers Mill Rd
Clarksville, TN 37042
(931) 553-2059
Clarksville, TN 37042
(931) 553-2059
Grades: PK-5
| 663 students
Rank: #3131.
Northeast Middle School
(Math: 26% | Reading: 23%)
Rank:
Rank:
4/
Bottom 50%10
3703 Trenton Rd
Clarksville, TN 37040
(931) 648-5665
Clarksville, TN 37040
(931) 648-5665
Grades: 6-8
| 1,077 students
Rank: #3232.
Norman Smith Elementary School
(Math: 16% | Reading: 29%)
Rank:
Rank:
3/
Bottom 50%10
740 Greenwood Ave
Clarksville, TN 37040
(931) 648-5660
Clarksville, TN 37040
(931) 648-5660
Grades: PK-5
| 578 students
Rank: #3333.
Kenwood Middle School
(Math: 15% | Reading: 21%)
Rank:
Rank:
2/
Bottom 50%10
241 E Pine Mountain Rd
Clarksville, TN 37042
(931) 553-2080
Clarksville, TN 37042
(931) 553-2080
Grades: 6-8
| 1,121 students
Rank: n/an/a
2700 Rossview Rd
Clarksville, TN 37043
(931) 342-8937
Clarksville, TN 37043
(931) 342-8937
Grades: 6-8
| 1,153 students
Recent Articles

Year-Round Or Traditional Schedule?
Which is more appropriate for your child? A year-round attendance schedule or traditional schedule? We look at the pros and cons.

Why You Should Encourage Your Child to Join a Sports Team
Participating in team sports has a great many benefits for children, there is no doubt. In this article you will learn what those benefits are.

White Students are Now the Minority in U.S. Public Schools
Increasing birth rates among immigrant families from Asia and Central and South America, combined with lower birth rates among white families, means that for the first time in history, public school students in the United States are majority-minority. This shift in demographics poses difficulties for schools as they work to accommodate children of varying language abilities and socio-economic backgrounds.


