Top Rankings
Carrollton-Farmers Branch Independent School District ranks among the top 20% of public school district in Texas for:
Category
Attribute
Diversity
Most diverse schools (Top 1%)
Community Size
Largest student body (number of students) (Top 1%)
For the 2025 school year, there are 40 public schools serving 24,386 students in Carrollton-Farmers Branch Independent School District. This district's average testing ranking is 5/10, which is in the bottom 50% of public schools in Texas.
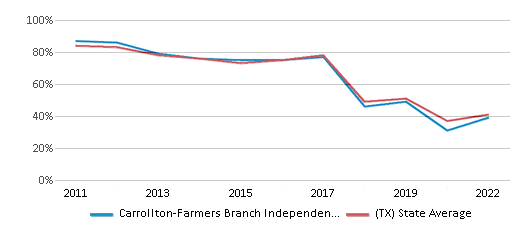
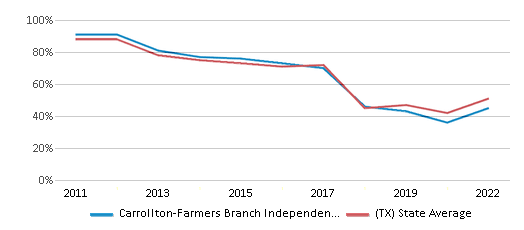
Public Schools in Carrollton-Farmers Branch Independent School District have an average math proficiency score of 39% (versus the Texas public school average of 41%), and reading proficiency score of 45% (versus the 51% statewide average).
Minority enrollment is 90% of the student body (majority Hispanic), which is more than the Texas public school average of 75% (majority Hispanic).
Overview
This School District
This State (TX)
# Schools
40 Schools
9,320 Schools
# Students
24,386 Students
5,529,984 Students
# Teachers
1,866 Teachers
374,844 Teachers
Student : Teacher Ratio
13:1
13:1
District Rank
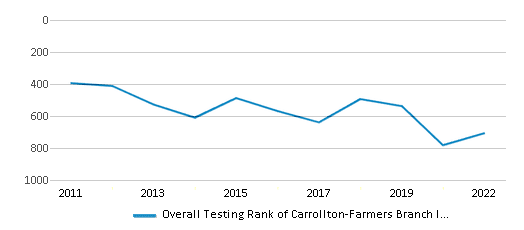
Carrollton-Farmers Branch Independent School District, which is ranked #698 of all 1,196 school districts in Texas (based off of combined math and reading proficiency testing data) for the 2021-2022 school year.
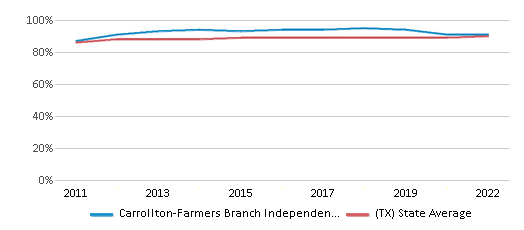
The school district's graduation rate of 91% has decreased from 94% over five school years.
Overall District Rank
#706 out of 1204 school districts
(Bottom 50%)
(Bottom 50%)
Math Test Scores (% Proficient)
39%
41%
Reading/Language Arts Test Scores (% Proficient)
45%
51%
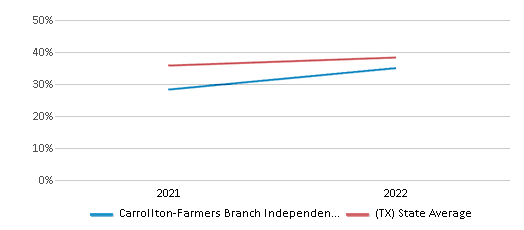
Science Test Scores (% Proficient)
42%
46%
Graduation Rate
91%
90%
Students by Ethnicity:
Diversity Score
0.62
0.64
# American Indian Students
88 Students
17,916 Students
% American Indian Students
n/a
n/a
# Asian Students
2,992 Students
296,049 Students
% Asian Students
12%
6%
# Hispanic Students
14,089 Students
2,942,422 Students
% Hispanic Students
58%
53%
# Black Students
3,946 Students
706,008 Students
% Black Students
16%
13%
# White Students
2,430 Students
1,384,941 Students
% White Students
10%
25%
# Hawaiian Students
16 Students
8,841 Students
% Hawaiian Students
n/a
n/a
# Two or more races Students
825 Students
173,807 Students
% of Two or more races Students
4%
3%
Students by Grade:
# Students in PK Grade:
1,343
275,832
# Students in K Grade:
1,793
361,958
# Students in 1st Grade:
1,895
385,427
# Students in 2nd Grade:
1,940
402,148
# Students in 3rd Grade:
1,896
399,623
# Students in 4th Grade:
1,806
398,690
# Students in 5th Grade:
1,819
399,071
# Students in 6th Grade:
1,532
402,143
# Students in 7th Grade:
1,566
406,424
# Students in 8th Grade:
1,690
414,179
# Students in 9th Grade:
2,079
472,263
# Students in 10th Grade:
1,777
438,622
# Students in 11th Grade:
1,779
406,207
# Students in 12th Grade:
1,471
367,397
# Ungraded Students:
-
-
District Revenue and Spending
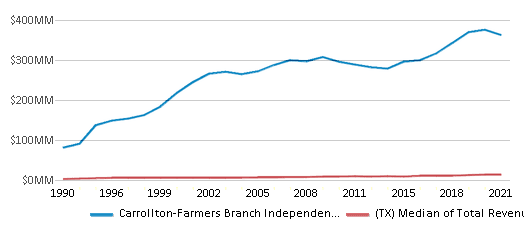
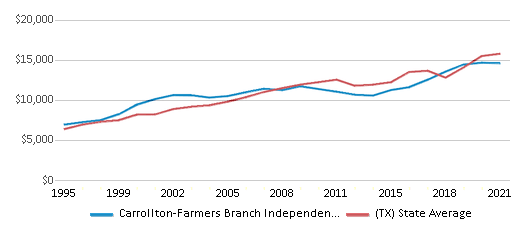
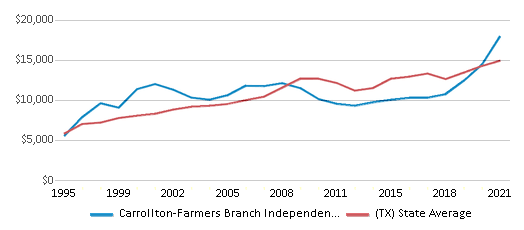
The revenue/student of $14,892 is higher than the state median of $13,387. The school district revenue/student has stayed relatively flat over four school years.
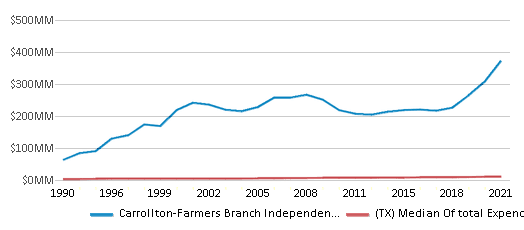
The school district's spending/student of $18,325 is higher than the state median of $14,116. The school district spending/student has stayed relatively flat over four school years.
Total Revenue
$363 MM
$74,029 MM
Spending
$447 MM
$78,063 MM
Revenue / Student
$14,892
$13,387
Spending / Student
$18,325
$14,116
Best Carrollton-Farmers Branch Independent School District Public Schools (2025)
School
(Math and Reading Proficiency)
(Math and Reading Proficiency)
Location
Grades
Students
Rank: #11.
Mccoy Elementary School
(Math: 83% | Reading: 80%)
Rank:
Rank:
10/
Top 5%10
2425 Mccoy Rd
Carrollton, TX 75006
(972) 968-2300
Carrollton, TX 75006
(972) 968-2300
Grades: K-5
| 432 students
Rank: #22.
Early College High School
(Math: 75-79% | Reading: 75-79%)
Rank:
Rank:
10/
Top 5%10
3939 Vly View Ln Bldg G
Dallas, TX 75244
(972) 968-6200
Dallas, TX 75244
(972) 968-6200
Grades: 9-12
| 356 students
Rank: #33.
Kent Elementary School
(Math: 60-64% | Reading: 75-79%)
Rank:
Rank:
10/
Top 10%10
1800 W Rosemeade Pkwy
Carrollton, TX 75007
(972) 968-2000
Carrollton, TX 75007
(972) 968-2000
Grades: PK-5
| 433 students
Rank: #44.
Rosemeade Elementary School
(Math: 50-54% | Reading: 70-74%)
Rank:
Rank:
9/
Top 20%10
3550 Kimberly
Carrollton, TX 75007
(972) 968-3000
Carrollton, TX 75007
(972) 968-3000
Grades: PK-5
| 392 students
Rank: #55.
Country Place Elementary School
(Math: 50% | Reading: 70%)
Rank:
Rank:
9/
Top 20%10
2115 Raintree
Carrollton, TX 75006
(972) 968-1400
Carrollton, TX 75006
(972) 968-1400
Grades: K-5
| 379 students
Rank: #66.
Blair Elementary School
(Math: 60% | Reading: 60%)
Rank:
Rank:
9/
Top 20%10
14055 Heartside Dr
Dallas, TX 75234
(972) 968-1000
Dallas, TX 75234
(972) 968-1000
Grades: PK-5
| 496 students
Rank: #77.
La Villita Elementary School
(Math: 57% | Reading: 61%)
Rank:
Rank:
9/
Top 20%10
1601 Camino Lago Way
Irving, TX 75039
(972) 968-6900
Irving, TX 75039
(972) 968-6900
Grades: K-5
| 773 students
Rank: #88.
Riverchase Ele
(Math: 50-54% | Reading: 55-59%)
Rank:
Rank:
8/
Top 30%10
272 S Macarthur Blvd
Coppell, TX 75019
(972) 968-2900
Coppell, TX 75019
(972) 968-2900
Grades: PK-5
| 466 students
Rank: #99.
Las Colinas Elementary School
(Math: 47% | Reading: 59%)
Rank:
Rank:
8/
Top 30%10
2200 Kinwest Pkwy
Irving, TX 75063
(972) 968-2200
Irving, TX 75063
(972) 968-2200
Grades: PK-5
| 551 students
Rank: #1010.
Blalack Middle School
(Math: 51% | Reading: 55%)
Rank:
Rank:
8/
Top 30%10
1706 Peters Colony
Carrollton, TX 75007
(972) 968-3500
Carrollton, TX 75007
(972) 968-3500
Grades: 6-8
| 889 students
Rank: #1111.
Rainwater Elementary School
(Math: 45-49% | Reading: 55-59%)
Rank:
Rank:
8/
Top 30%10
1408 E Frankford
Carrollton, TX 75007
(972) 968-2800
Carrollton, TX 75007
(972) 968-2800
Grades: PK-5
| 351 students
Rank: #1212.
Freeman Elementary School
(Math: 51% | Reading: 54%)
Rank:
Rank:
7/
Top 50%10
8757 Valley Ranch Pkwy
Irving, TX 75063
(972) 968-1700
Irving, TX 75063
(972) 968-1700
Grades: PK-5
| 722 students
Rank: #1313.
Thompson Elementary School
(Math: 48% | Reading: 56%)
Rank:
Rank:
7/
Top 50%10
2915 Scott Mill Rd
Carrollton, TX 75007
(972) 968-3400
Carrollton, TX 75007
(972) 968-3400
Grades: PK-5
| 486 students
Rank: #1414.
Landry Elementary School
(Math: 41% | Reading: 56%)
Rank:
Rank:
6/
Top 50%10
265 Red River Trl
Irving, TX 75063
(972) 968-2100
Irving, TX 75063
(972) 968-2100
Grades: PK-5
| 535 students
Rank: #1515.
Farmers Branch Elementary School
(Math: 45% | Reading: 51%)
Rank:
Rank:
6/
Top 50%10
13521 Tom Field Rd
Dallas, TX 75234
(972) 968-1600
Dallas, TX 75234
(972) 968-1600
Grades: PK-5
| 474 students
Rank: #1616.
Creekview High School
(Math: 49% | Reading: 44%)
Rank:
Rank:
6/
Top 50%10
3201 Old Denton Rd
Carrollton, TX 75007
(972) 968-4800
Carrollton, TX 75007
(972) 968-4800
Grades: 9-12
| 1,680 students
Rank: #1717.
Davis Elementary School
(Math: 42% | Reading: 47%)
Rank:
Rank:
6/
Top 50%10
3205 Dorchester Dr
Carrollton, TX 75007
(972) 968-1500
Carrollton, TX 75007
(972) 968-1500
Grades: K-5
| 478 students
Rank: #1818.
Stark Elementary School
(Math: 39% | Reading: 49%)
Rank:
Rank:
5/
Bottom 50%10
12400 Josey Ln
Dallas, TX 75234
(972) 968-3300
Dallas, TX 75234
(972) 968-3300
Grades: PK-5
| 701 students
Rank: #1919.
Perry Middle School
(Math: 40% | Reading: 44%)
Rank:
Rank:
5/
Bottom 50%10
1709 E Belt Line Rd
Carrollton, TX 75006
(972) 968-4400
Carrollton, TX 75006
(972) 968-4400
Grades: 6-8
| 789 students
Rank: #2020.
Carrollton Elementary School
(Math: 47% | Reading: 35%)
Rank:
Rank:
5/
Bottom 50%10
1805 Pearl St
Carrollton, TX 75006
(972) 968-1200
Carrollton, TX 75006
(972) 968-1200
Grades: PK-5
| 519 students
Rank: #2121.
Good Elementary School
(Math: 42% | Reading: 39%)
Rank:
Rank:
5/
Bottom 50%10
1012 Study Ln
Carrollton, TX 75006
(972) 968-1900
Carrollton, TX 75006
(972) 968-1900
Grades: PK-5
| 515 students
Rank: #2222.
Blanton Elementary School
(Math: 30-34% | Reading: 45-49%)
Rank:
Rank:
5/
Bottom 50%10
2525 Scott Mill Rd
Carrollton, TX 75006
(972) 968-1100
Carrollton, TX 75006
(972) 968-1100
Grades: PK-5
| 468 students
Rank: #2323.
Furneaux Elementary School
(Math: 35-39% | Reading: 40-44%)
Rank:
Rank:
4/
Bottom 50%10
3210 Furneaux Rd
Carrollton, TX 75007
(972) 968-1800
Carrollton, TX 75007
(972) 968-1800
Grades: PK-5
| 336 students
Rank: #2424.
Field Middle School
(Math: 36% | Reading: 43%)
Rank:
Rank:
4/
Bottom 50%10
13551 Dennis Ln
Dallas, TX 75234
(972) 968-3900
Dallas, TX 75234
(972) 968-3900
Grades: 6-8
| 909 students
Rank: #2525.
Grimes Education Center
Alternative School
(Math: <50% | Reading: ≤20%)
Rank:
Rank:
4/
Bottom 50%10
1745 Hutton
Carrollton, TX 75006
(972) 968-5600
Carrollton, TX 75006
(972) 968-5600
Grades: 9-12
| 107 students
Rank: #2626.
Bush Middle School
(Math: 34% | Reading: 42%)
Rank:
Rank:
4/
Bottom 50%10
515 Cowboys Pkwy
Irving, TX 75063
(972) 968-3700
Irving, TX 75063
(972) 968-3700
Grades: 6-8
| 695 students
Rank: #2727.
Polk Middle School
(Math: 31% | Reading: 42%)
Rank:
Rank:
3/
Bottom 50%10
2001 Kelly Blvd
Carrollton, TX 75006
(972) 968-4600
Carrollton, TX 75006
(972) 968-4600
Grades: 6-8
| 949 students
Rank: #2828.
Central Elementary School
(Math: 36% | Reading: 33%)
Rank:
Rank:
3/
Bottom 50%10
1600 S Perry Rd
Carrollton, TX 75006
(972) 968-1300
Carrollton, TX 75006
(972) 968-1300
Grades: PK-5
| 461 students
Rank: #2929.
Mckamy Elementary School
(Math: 30% | Reading: 38%)
Rank:
Rank:
3/
Bottom 50%10
3443 Briargrove Ln
Dallas, TX 75287
(972) 968-2400
Dallas, TX 75287
(972) 968-2400
Grades: PK-5
| 523 students
Rank: #3030.
Ranchview High School
(Math: 27% | Reading: 41%)
Rank:
Rank:
3/
Bottom 50%10
8401 Vly Ranch Pkwy E
Irving, TX 75063
(972) 968-5000
Irving, TX 75063
(972) 968-5000
Grades: 9-12
| 908 students
Rank: #3131.
Mclaughlin Strickland Elementary School
(Math: 28% | Reading: 33%)
Rank:
Rank:
2/
Bottom 50%10
3030 Fyke Rd
Dallas, TX 75234
(972) 968-5700
Dallas, TX 75234
(972) 968-5700
Grades: PK-5
| 684 students
Rank: #3232.
Smith High School
(Math: 31% | Reading: 30%)
Rank:
Rank:
2/
Bottom 50%10
2335 N Josey Ln
Carrollton, TX 75006
(972) 968-5200
Carrollton, TX 75006
(972) 968-5200
Grades: 9-12
| 1,937 students
Rank: #3333.
Turner High School
(Math: 25% | Reading: 33%)
Rank:
Rank:
2/
Bottom 50%10
1600 Josey Ln
Carrollton, TX 75006
(972) 968-5400
Carrollton, TX 75006
(972) 968-5400
Grades: 9-12
| 2,010 students
Rank: #3434.
Long Middle School
(Math: 19% | Reading: 33%)
Rank:
Rank:
1/
Bottom 50%10
2525 Frankford
Dallas, TX 75287
(972) 662-4100
Dallas, TX 75287
(972) 662-4100
Grades: 6-8
| 532 students
Rank: #3535.
Mcwhorter Elementary School
(Math: 15% | Reading: 35%)
Rank:
Rank:
1/
Bottom 50%10
3678 Timberglen Rd
Dallas, TX 75287
(972) 968-2600
Dallas, TX 75287
(972) 968-2600
Grades: PK-5
| 651 students
Show 5 more public schools in Carrollton-Farmers Branch Independent School District (out of 40 total schools)
Loading...
Frequently Asked Questions
How many schools belong to Carrollton-Farmers Branch Independent School District?
Carrollton-Farmers Branch Independent School District manages 40 public schools serving 24,386 students.
What is the rank of Carrollton-Farmers Branch Independent School District?
Carrollton-Farmers Branch Independent School District is ranked #698 out of 1,196 school districts in Texas (bottom 50%) based off of combined math and reading proficiency testing data for the 2021-2022 school year. This district ranks in the top 20% of Texas school districts for: Most diverse schools (Top 1%) and Largest student body (number of students) (Top 1%)
What is the racial composition of students in Carrollton-Farmers Branch Independent School District?
58% of Carrollton-Farmers Branch Independent School District students are Hispanic, 16% of students are Black, 12% of students are Asian, 10% of students are White, and 4% of students are Two or more races.
What is the student/teacher ratio of Carrollton-Farmers Branch Independent School District?
Carrollton-Farmers Branch Independent School District has a student/teacher ratio of 13:1, which is lower than the Texas state average of 15:1.
What is Carrollton-Farmers Branch Independent School District's spending/student ratio?
The school district's spending/student of $18,325 is higher than the state median of $14,116. The school district spending/student has stayed relatively flat over four school years.
Recent Articles

What Is A Charter School?
Explore the world of charter schools in this comprehensive guide. Learn about their history, how they operate, and the pros and cons of this educational innovation. Discover key facts about charter schools, including admission policies, demographics, and funding, as well as what to look for when considering a charter school for your child.

10 Reasons Why High School Sports Benefit Students
Discover the 10 compelling reasons why high school sports are beneficial for students. This comprehensive article explores how athletics enhance academic performance, foster personal growth, and develop crucial life skills. From improved fitness and time management to leadership development and community representation, learn why participating in high school sports can be a game-changer for students' overall success and well-being.

February 05, 2025
Understanding the U.S. Department of Education: Structure, Impact, and EvolutionWe explore how the Department of Education shapes American education, from its cabinet-level leadership to its impact on millions of students, written for general audiences seeking clarity on this vital institution.


