Top Rankings
Fort Bend Independent School District ranks among the top 20% of public school district in Texas for:
Category
Attribute
Diversity
Most diverse schools (Top 1%)
Community Size
Largest student body (number of students) (Top 1%)
For the 2025 school year, there are 70 public elementary schools serving 53,717 students in Fort Bend Independent School District. This district's average elementary testing ranking is 9/10, which is in the top 20% of public elementary schools in Texas.
Public Elementary Schools in Fort Bend Independent School District have an average math proficiency score of 51% (versus the Texas public elementary school average of 42%), and reading proficiency score of 62% (versus the 52% statewide average).
Minority enrollment is 87% of the student body (majority Asian and Hispanic), which is more than the Texas public elementary school average of 75% (majority Hispanic).
Overview
This School District
This State (TX)
# Schools
85 Schools
6,902 Schools
# Students
80,206 Students
3,737,053 Students
# Teachers
4,905 Teachers
255,471 Teachers
Student : Teacher Ratio
16:1
16:1
District Rank
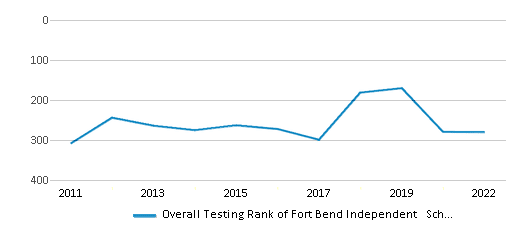
Fort Bend Independent School District, which is ranked #273 of all 1,196 school districts in Texas (based off of combined math and reading proficiency testing data) for the 2021-2022 school year.
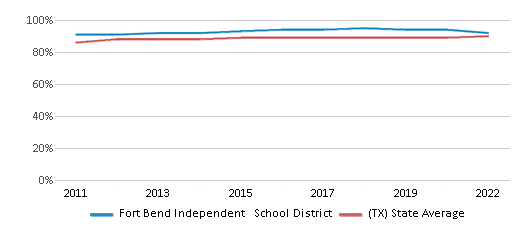
The school district's graduation rate of 92% has decreased from 94% over five school years.
Overall District Rank
#280 out of 1204 school districts
(Top 30%)
(Top 30%)
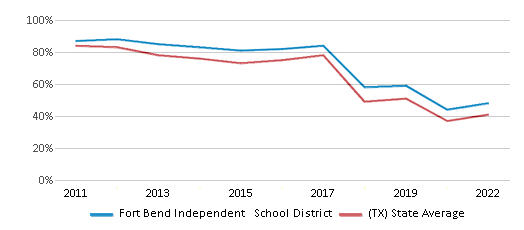
Math Test Scores (% Proficient)
48%
41%
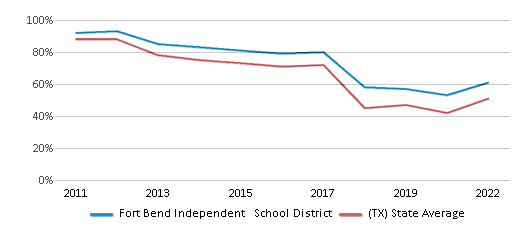
Reading/Language Arts Test Scores (% Proficient)
61%
51%
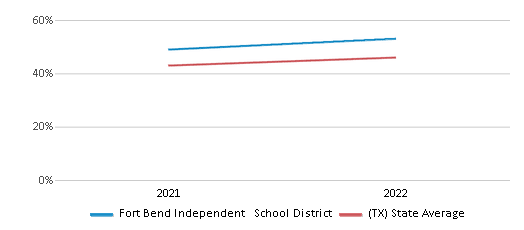
Science Test Scores (% Proficient)
53%
46%
Graduation Rate
92%
90%
Students by Ethnicity:
Diversity Score
0.76
0.64
# American Indian Students
360 Students
11,705 Students
% American Indian Students
n/a
n/a
# Asian Students
22,112 Students
203,767 Students
% Asian Students
28%
6%
# Hispanic Students
21,435 Students
1,997,454 Students
% Hispanic Students
27%
53%
# Black Students
22,275 Students
469,194 Students
% Black Students
28%
13%
# White Students
10,644 Students
924,841 Students
% White Students
13%
25%
# Hawaiian Students
111 Students
5,879 Students
% Hawaiian Students
n/a
n/a
# Two or more races Students
3,269 Students
124,213 Students
% of Two or more races Students
4%
3%
Students by Grade:
# Students in PK Grade:
2,713
222,501
# Students in K Grade:
4,602
346,866
# Students in 1st Grade:
5,156
385,427
# Students in 2nd Grade:
5,472
402,148
# Students in 3rd Grade:
5,583
399,623
# Students in 4th Grade:
5,687
398,690
# Students in 5th Grade:
5,842
399,071
# Students in 6th Grade:
6,033
402,143
# Students in 7th Grade:
6,185
335,034
# Students in 8th Grade:
6,349
339,814
# Students in 9th Grade:
7,299
32,833
# Students in 10th Grade:
6,868
28,116
# Students in 11th Grade:
6,460
23,862
# Students in 12th Grade:
5,957
20,925
# Ungraded Students:
-
-
District Revenue and Spending
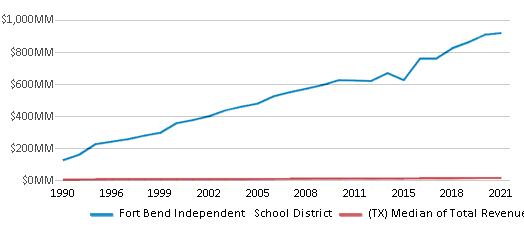
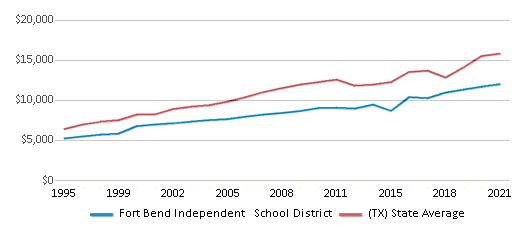
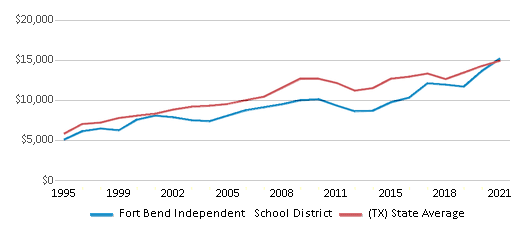
The revenue/student of $11,473 in this school district is less than the state median of $13,387. The school district revenue/student has stayed relatively flat over four school years.
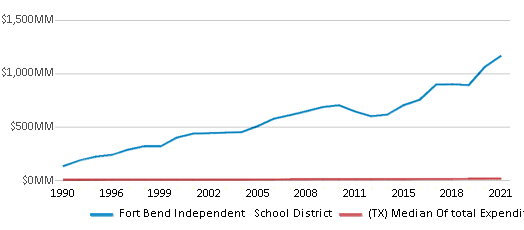
The school district's spending/student of $14,533 is higher than the state median of $14,116. The school district spending/student has stayed relatively flat over four school years.
Total Revenue
$920 MM
$74,029 MM
Spending
$1,166 MM
$78,063 MM
Revenue / Student
$11,473
$13,387
Spending / Student
$14,533
$14,116
Best Fort Bend Independent School District Public Elementary Schools (2025)
School
(Math and Reading Proficiency)
(Math and Reading Proficiency)
Location
Grades
Students
Rank: #11.
Commonwealth Elementary School
(Math: 90% | Reading: 94%)
Rank:
Rank:
10/
Top 1%10
4909 Commonwealth Blvd
Sugar Land, TX 77479
(281) 634-5120
Sugar Land, TX 77479
(281) 634-5120
Grades: PK-5
| 652 students
Rank: #22.
Anne Mccormick Sullivan Elementary School
(Math: 81% | Reading: 88%)
Rank:
Rank:
10/
Top 1%10
17828 Winding Waters Ln
Sugar Land, TX 77479
(281) 327-2860
Sugar Land, TX 77479
(281) 327-2860
Grades: PK-5
| 1,066 students
Rank: #33.
Cornerstone Elementary School
(Math: 83% | Reading: 86%)
Rank:
Rank:
10/
Top 5%10
1800 Chatham Ave
Sugar Land, TX 77479
(281) 634-6400
Sugar Land, TX 77479
(281) 634-6400
Grades: PK-5
| 850 students
Rank: #44.
Fort Settlement Middle School
(Math: 84% | Reading: 84%)
Rank:
Rank:
10/
Top 5%10
5440 Elkins Rd
Sugar Land, TX 77479
(281) 634-6440
Sugar Land, TX 77479
(281) 634-6440
Grades: 6-8
| 1,529 students
Rank: #55.
Sienna Crossing Elementary School
(Math: 77% | Reading: 85%)
Rank:
Rank:
10/
Top 5%10
10011 Steep Bank Trace
Missouri City, TX 77459
(281) 634-3680
Missouri City, TX 77459
(281) 634-3680
Grades: PK-5
| 1,048 students
Rank: #66.
Walker Station Elementary School
(Math: 79% | Reading: 81%)
Rank:
Rank:
10/
Top 5%10
6200 Homeward Way Blvd
Sugar Land, TX 77479
(281) 634-4400
Sugar Land, TX 77479
(281) 634-4400
Grades: PK-5
| 776 students
Rank: #77.
Colony Meadows Elementary School
(Math: 76% | Reading: 83%)
Rank:
Rank:
10/
Top 5%10
4510 Sweetwater Blvd
Sugar Land, TX 77479
(281) 634-4120
Sugar Land, TX 77479
(281) 634-4120
Grades: PK-5
| 638 students
Rank: #88.
Carolyn And Vernon Madden Elementary School
(Math: 76% | Reading: 80%)
Rank:
Rank:
10/
Top 5%10
17727 Abermore Ln
Richmond, TX 77407
(281) 327-2740
Richmond, TX 77407
(281) 327-2740
Grades: PK-5
| 967 students
Rank: #99.
Sartartia Middle School
(Math: 73% | Reading: 80%)
Rank:
Rank:
10/
Top 5%10
8125 Homeward Way
Sugar Land, TX 77479
(281) 634-6310
Sugar Land, TX 77479
(281) 634-6310
Grades: 6-8
| 1,451 students
Rank: #1010.
Malala Yousafzai
(Math: 70% | Reading: 78%)
Rank:
Rank:
10/
Top 10%10
11770 W Aliana Trace Dr
Richmond, TX 77407
(281) 634-1000
Richmond, TX 77407
(281) 634-1000
Grades: PK-5
| 1,127 students
Rank: #1111.
Donald Leonetti Elementary School
(Math: 62% | Reading: 78%)
Rank:
Rank:
10/
Top 10%10
1757 Waters Lake Blvd
Missouri City, TX 77459
(281) 327-3190
Missouri City, TX 77459
(281) 327-3190
Grades: PK-5
| 837 students
Rank: #1212.
Macario Garcia Middle School
(Math: 63% | Reading: 75%)
Rank:
Rank:
10/
Top 10%10
18550 Old Richmond Rd
Sugar Land, TX 77498
(281) 634-3160
Sugar Land, TX 77498
(281) 634-3160
Grades: 6-8
| 1,407 students
Rank: #1313.
Scanlan Oaks Elementary School
(Math: 66% | Reading: 71%)
Rank:
Rank:
10/
Top 10%10
9000 Camp Sienna Trail
Missouri City, TX 77459
(281) 634-3950
Missouri City, TX 77459
(281) 634-3950
Grades: PK-5
| 752 students
Rank: #1414.
Oakland Elementary School
(Math: 62% | Reading: 72%)
Rank:
Rank:
10/
Top 10%10
4455 Waterside Estates Dr
Richmond, TX 77406
(281) 634-3730
Richmond, TX 77406
(281) 634-3730
Grades: K-5
| 876 students
Rank: #1515.
Highlands Elementary School
(Math: 62% | Reading: 71%)
Rank:
Rank:
9/
Top 20%10
2022 Colonist Park Dr
Sugar Land, TX 77478
(281) 634-4160
Sugar Land, TX 77478
(281) 634-4160
Grades: PK-5
| 610 students
Rank: #1616.
First Colony Middle School
(Math: 62% | Reading: 69%)
Rank:
Rank:
9/
Top 20%10
3225 Austin Pkwy
Sugar Land, TX 77479
(281) 634-3240
Sugar Land, TX 77479
(281) 634-3240
Grades: 6-8
| 1,285 students
Rank: #1717.
Settlers Way Elementary School
(Math: 60% | Reading: 71%)
Rank:
Rank:
9/
Top 20%10
3015 Settlers Way Dr
Sugar Land, TX 77479
(281) 634-4360
Sugar Land, TX 77479
(281) 634-4360
Grades: PK-5
| 690 students
Rank: #18 - 2018. - 20.
Austin Parkway Elementary School
(Math: 57% | Reading: 71%)
Rank:
Rank:
9/
Top 20%10
4400 Austin Pkwy
Sugar Land, TX 77479
(281) 634-4001
Sugar Land, TX 77479
(281) 634-4001
Grades: PK-5
| 593 students
Rank: #18 - 2018. - 20.
Jan Schiff Elementary School
(Math: 58% | Reading: 70%)
Rank:
Rank:
9/
Top 20%10
7400 Discovery Ln
Missouri City, TX 77459
(281) 634-9451
Missouri City, TX 77459
(281) 634-9451
Grades: PK-5
| 827 students
Rank: #18 - 2018. - 20.
Quail Valley Middle School
(Math: 58% | Reading: 70%)
Rank:
Rank:
9/
Top 20%10
3019 Fm 1092
Missouri City, TX 77459
(281) 634-3600
Missouri City, TX 77459
(281) 634-3600
Grades: 6-8
| 1,042 students
Rank: #2121.
Colony Bend Elementary School
(Math: 51% | Reading: 72%)
Rank:
Rank:
9/
Top 20%10
2720 Planters St
Sugar Land, TX 77479
(281) 634-4080
Sugar Land, TX 77479
(281) 634-4080
Grades: PK-5
| 537 students
Rank: #2222.
James Bowie Middle School
(Math: 53% | Reading: 68%)
Rank:
Rank:
9/
Top 20%10
700 Plantation Dr
Richmond, TX 77406
(281) 327-6200
Richmond, TX 77406
(281) 327-6200
Grades: 6-8
| 1,472 students
Rank: #2323.
Rita Drabek Elementary School
(Math: 57% | Reading: 63%)
Rank:
Rank:
9/
Top 20%10
11325 Lake Woodbridge Dr
Sugar Land, TX 77498
(281) 634-6570
Sugar Land, TX 77498
(281) 634-6570
Grades: PK-5
| 705 students
Rank: #2424.
Brazos Bend Elementary School
(Math: 53% | Reading: 67%)
Rank:
Rank:
9/
Top 20%10
621 Cunningham Creek Blvd
Sugar Land, TX 77479
(281) 634-5180
Sugar Land, TX 77479
(281) 634-5180
Grades: PK-5
| 720 students
Rank: #2525.
Oyster Creek Elementary School
(Math: 53% | Reading: 65%)
Rank:
Rank:
9/
Top 20%10
16425 Mellow Oaks Ln
Sugar Land, TX 77498
(281) 634-5910
Sugar Land, TX 77498
(281) 634-5910
Grades: PK-5
| 826 students
Rank: #2626.
Barrington Place Elementary School
(Math: 53% | Reading: 64%)
Rank:
Rank:
8/
Top 30%10
2100 Squire Dobbins Dr
Sugar Land, TX 77478
(281) 634-4040
Sugar Land, TX 77478
(281) 634-4040
Grades: PK-5
| 355 students
Rank: #2727.
Lexington Creek Elementary School
(Math: 51% | Reading: 63%)
Rank:
Rank:
8/
Top 30%10
2335 Dulles Ave
Missouri City, TX 77459
(281) 634-5000
Missouri City, TX 77459
(281) 634-5000
Grades: PK-5
| 521 students
Rank: #2828.
Barbara Jordan Elementary School
(Math: 52% | Reading: 59%)
Rank:
Rank:
8/
Top 30%10
17800 W Oaks Village Dr
Richmond, TX 77407
(281) 634-2800
Richmond, TX 77407
(281) 634-2800
Grades: PK-5
| 472 students
Rank: #2929.
James C Neill Elementary School
(Math: 45% | Reading: 65%)
Rank:
Rank:
8/
Top 30%10
3830 Harvest Corner Dr
Richmond, TX 77406
(281) 327-3760
Richmond, TX 77406
(281) 327-3760
Grades: PK-5
| 1,138 students
Rank: #3030.
Billy Baines Middle School
(Math: 49% | Reading: 60%)
Rank:
Rank:
8/
Top 30%10
9000 Sienna Ranch Rd
Missouri City, TX 77459
(281) 634-6870
Missouri City, TX 77459
(281) 634-6870
Grades: 6-8
| 1,320 students
Rank: #3131.
Sugar Mill Elementary School
(Math: 45% | Reading: 63%)
Rank:
Rank:
8/
Top 30%10
13707 Jess Pirtle Blvd
Sugar Land, TX 77498
(281) 634-4440
Sugar Land, TX 77498
(281) 634-4440
Grades: PK-5
| 644 students
Rank: #3232.
Pecan Grove Elementary School
(Math: 48% | Reading: 59%)
Rank:
Rank:
8/
Top 30%10
3330 Old S Dr
Richmond, TX 77406
(281) 634-4800
Richmond, TX 77406
(281) 634-4800
Grades: PK-5
| 725 students
Rank: #3333.
Palmer Elementary School
(Math: 42% | Reading: 65%)
Rank:
Rank:
8/
Top 30%10
4208 Crow Valley Dr
Missouri City, TX 77459
(281) 634-4760
Missouri City, TX 77459
(281) 634-4760
Grades: PK-5
| 819 students
Rank: #3434.
Lakeview Elementary School
(Math: 50-54% | Reading: 50-54%)
Rank:
Rank:
7/
Top 50%10
314 Lakeview Dr
Sugar Land, TX 77498
(281) 634-4200
Sugar Land, TX 77498
(281) 634-4200
Grades: PK-5
| 337 students
Rank: #3535.
Ronald Thornton Middle School
(Math: 43% | Reading: 61%)
Rank:
Rank:
7/
Top 50%10
1909 Waters Lake Blvd
Missouri City, TX 77459
(281) 327-3870
Missouri City, TX 77459
(281) 327-3870
Grades: 6-8
| 1,695 students
Show 35 more public schools in Fort Bend Independent School District (out of 70 total schools)
Loading...
Recent Articles

Year-Round Or Traditional Schedule?
Which is more appropriate for your child? A year-round attendance schedule or traditional schedule? We look at the pros and cons.

Why You Should Encourage Your Child to Join a Sports Team
Participating in team sports has a great many benefits for children, there is no doubt. In this article you will learn what those benefits are.

White Students are Now the Minority in U.S. Public Schools
Increasing birth rates among immigrant families from Asia and Central and South America, combined with lower birth rates among white families, means that for the first time in history, public school students in the United States are majority-minority. This shift in demographics poses difficulties for schools as they work to accommodate children of varying language abilities and socio-economic backgrounds.


